Reporting
The analyst's guide to killing the reporting backlog (without hiring)
You know the number. Maybe it’s 200 open tickets. Maybe it’s a Slack channel with 47 unread messages, each one starting with “hey, quick question.” Maybe it’s the spreadsheet your team lead maintains – the one nobody talks about in standups – where every row is a request that won’t get touched this quarter.
The reporting backlog is the single most common symptom of a data team under pressure. It drives analyst burnout, blocks strategic work, and turns your best people into reactive report factories. And if you’re reading this, you’ve probably already tried the obvious fixes: intake forms, sprint planning, request prioritization, maybe even a new hire. None of them worked – or they worked for a month, then the reporting backlog filled back up.
That’s because the reporting backlog isn’t a process problem. It’s an architecture problem. And the fix isn’t better queue management – it’s to automate reporting delivery so the queue empties itself.
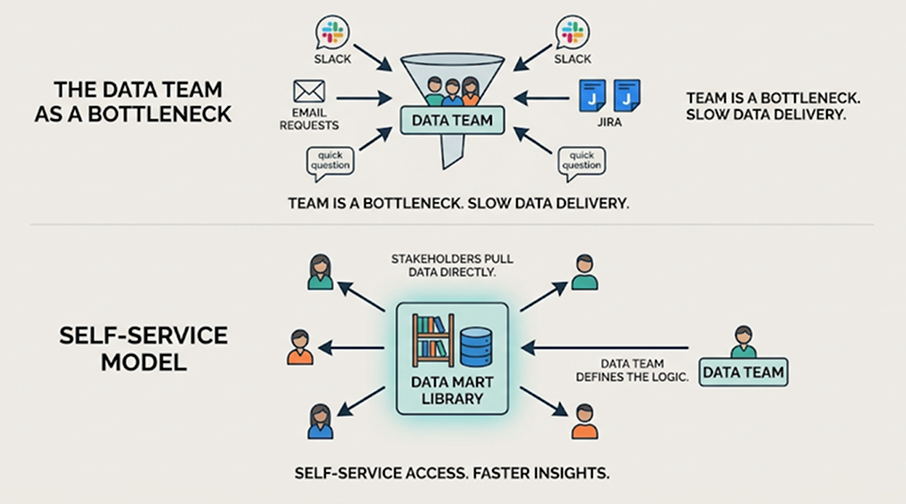
Why fixing existing process don’t fix it
Why fixing existing process don’t fix it
You’ve tried the process solutions. Here’s why they didn’t work.
Ticketing systems and intake forms
Standardizing requests helps triage. You stop getting “hey, can you pull something for me?” and start getting structured asks with deadlines and business context. That’s a real improvement – for about two weeks.
The problem is that intake forms don’t reduce volume. You still have the same number of questions. You just organized the queue. The bottleneck moves from “which request first?” to “when will the analyst get to it?” The ad-hoc reporting burden stays exactly the same – it’s just better documented.
Scrum for data teams
Sprint planning for analytics sounds right. Estimate the work, commit to a scope, protect the team’s time. Some teams even run two-week sprints with dedicated “analytics office hours” for stakeholders.
But ad-hoc requests don’t respect sprints. When the CMO asks for campaign performance before the board meeting, it doesn’t wait for next sprint. When finance needs a reconciliation number by Friday, it jumps the queue. Scrum organizes the work; it doesn’t eliminate the work that shouldn’t be manual in the first place.
Hiring another analyst
The most common response – and the most expensive band-aid. You add capacity. Demand grows to match it. Every new analyst who publishes reports creates new consumers who will ask for refreshes, variations, and “one more column.” I’ve watched teams go from 2 analysts to 6 and still have a backlog – because each new analyst also created new stakeholders who discovered they could get data if they just asked.
The backlog scales with the team. That’s not a hiring problem. That’s a design problem.
The backlog is an architecture problem, not a process problem
The backlog is an architecture problem, not a process problem
Here’s what the post-mortem always misses.
Every report in your backlog is a bespoke, manually-assembled artifact. The analyst writes SQL. Runs the query. Exports the result. Formats it. Delivers it via Sheets or Slack or email. Then repeats the whole thing next week, next month, next quarter – often with slightly different parameters.
The backlog exists because the delivery model is one analyst → many stakeholders, manual, and non-reusable. Every question gets a handmade answer. Every variation is a new ticket.
The fix isn’t better process on top of manual delivery. It’s removing the manual delivery entirely. Make the analyst’s work reusable – define the logic once, let everyone else pull from it – and the backlog disappears by design.
The backlog exists because every report is handmade. Make the logic reusable, and the queue empties itself.
This is the shift from analyst-as-bottleneck to analyst-as-architect. The analyst stops being reactive – pulling data on demand – and becomes strategic: defining how data is delivered across the organization. Same skills, higher leverage, radically less repetitive work.
The data mart library – define once, self-serve forever
The data mart library – define once, self-serve forever
Here’s the architecture that eliminates the manual delivery model.
What a data mart library is
A Data Mart is a governed, analyst-defined dataset that answers a business question correctly. The analyst writes the SQL (or points to an existing table or view), defines the schema – business-friendly aliases, descriptions, join keys – sets access controls, and publishes it to the library.
The data mart is a reusable artifact, not a one-off export. It refreshes on a schedule. It’s versioned. It’s governed. And anyone with access can pull from it without filing a ticket.
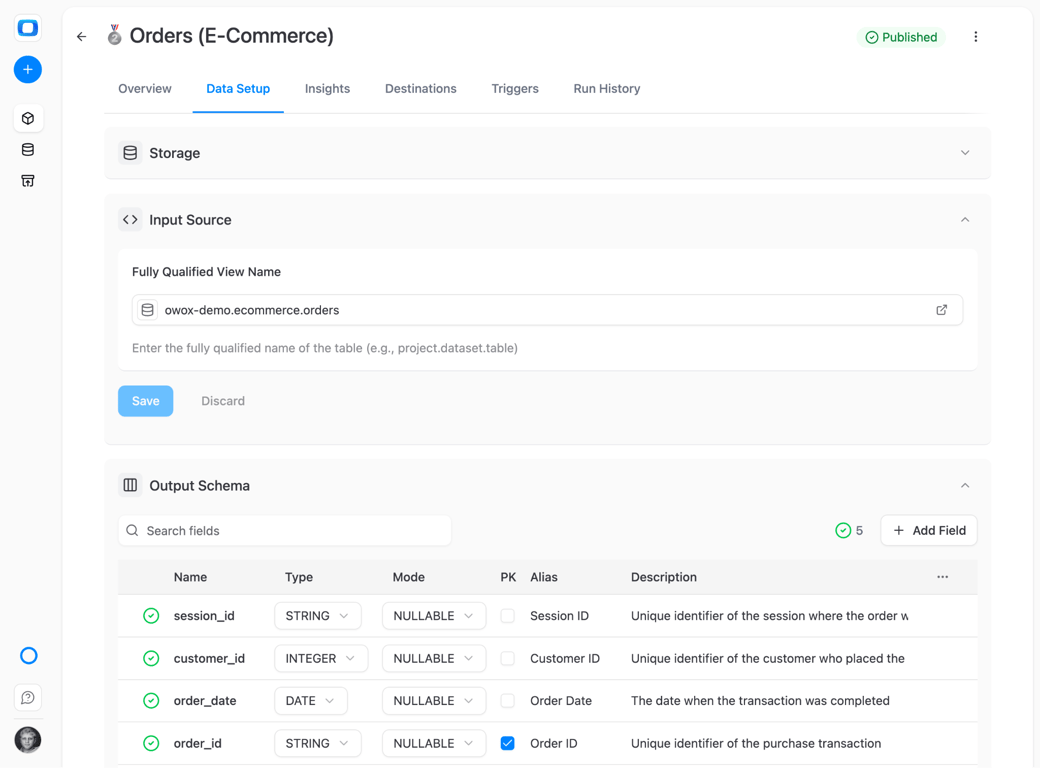
How business users self-serve from it
Business users open Google Sheets and browse the Data Mart library via the OWOX extension. They pick columns – including joined columns from related data marts (the analyst defined the join keys, so the joins are safe). They apply filters. They pull data. The Sheet refreshes on schedule.
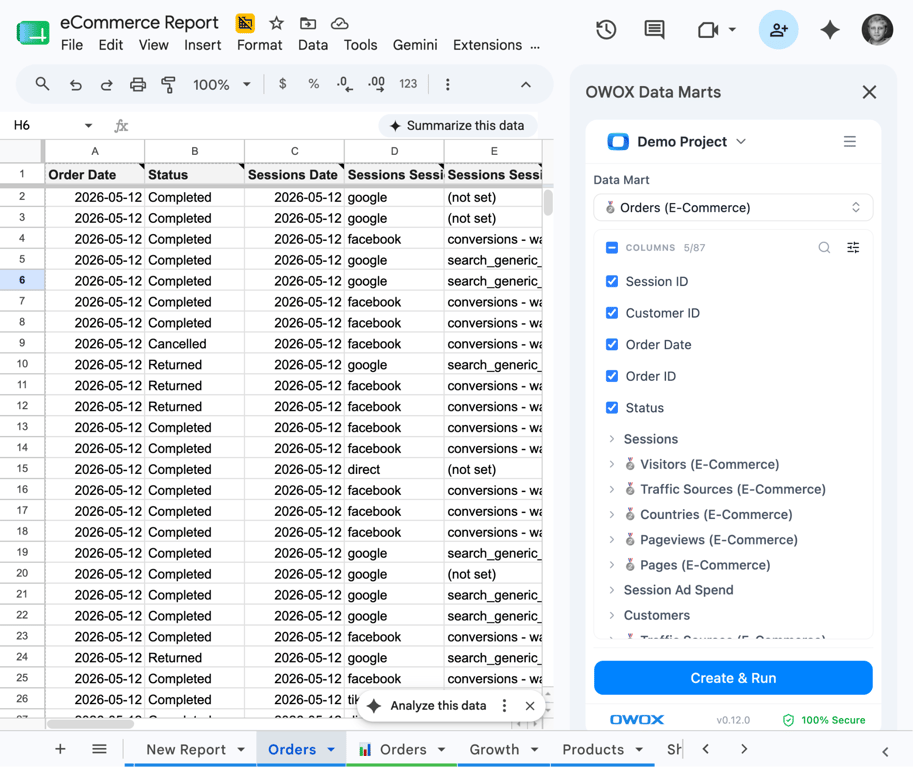
No SQL. No tickets. No “hey, can you refresh this?” The analyst’s survival guide to ad-hoc requests becomes unnecessary – because the requests stop.
What this does to the backlog
Every data mart the analyst publishes removes an entire class of requests – not one ticket, but every variation of that question, forever. “Revenue by channel this month” becomes a data mart. Next month, the business user refreshes it themselves. “Add last quarter” – they filter it themselves. “Break it by region” – they pick the column themselves.
The backlog shrinks by categories, not by individual tickets. And the analyst’s time shifts to the work that actually requires human judgment: metric definitions, variance diagnosis, business-logic mapping, and stakeholder translation.
| Dimension | Before (manual delivery) | After (data mart library) |
|---|---|---|
| How a question gets answered | Analyst writes SQL, exports, formats, delivers | Business user browses library, picks columns, pulls |
| Time to answer | 2–4 hours (plus queue wait) | Under 2 minutes |
| Who does the work | Analyst (every time) | Analyst (once) → business user (every time after) |
| Analyst spends time on | Data delivery and export | Metric definitions, variance diagnosis, business logic |
| Backlog trajectory | Grows with stakeholder count | Shrinks with each new mart published |
But what if business users break things?
But what if business users break things?
The most common objection from data leaders – and the most important one to address directly.
The analyst controls the logic
Business users can’t change the SQL. They can’t alter the metric definition. They can’t modify the join keys. They can only filter and select from what the analyst made available. The analyst is the governor – not the delivery person, but the person who decides what’s safe to self-serve and what isn’t.
This is the difference between “business users have access to the warehouse” (terrifying) and “business users browse a curated library of analyst-approved datasets” (governed). The data mart management layer is the boundary.
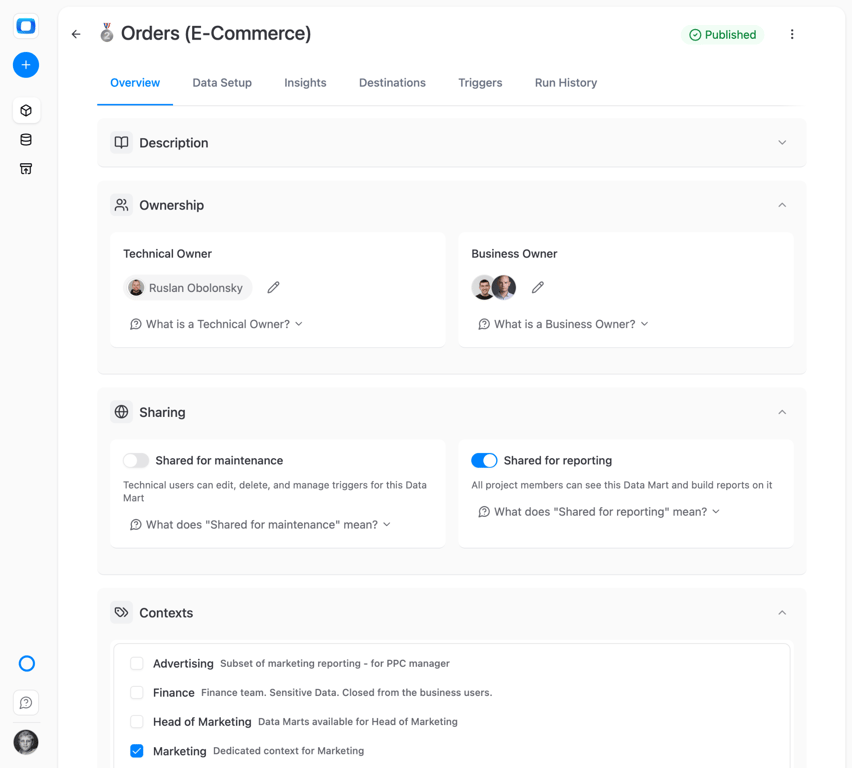
Every number traces back
Full SQL audit trail. Every cell in the Sheet traces to a query the analyst approved. No hallucinations, no AI-generated metrics, no business user computing their own version of revenue in a rogue spreadsheet. One source of truth, governed by the data team.
The irony: most data leaders worry that self-service will create chaos. In practice, the chaos already exists – it’s the shadow spreadsheet stack that grew because the official channel was too slow. A governed data mart library replaces the chaos with a controlled system. It’s not less governance; it’s more governance, delivered faster.
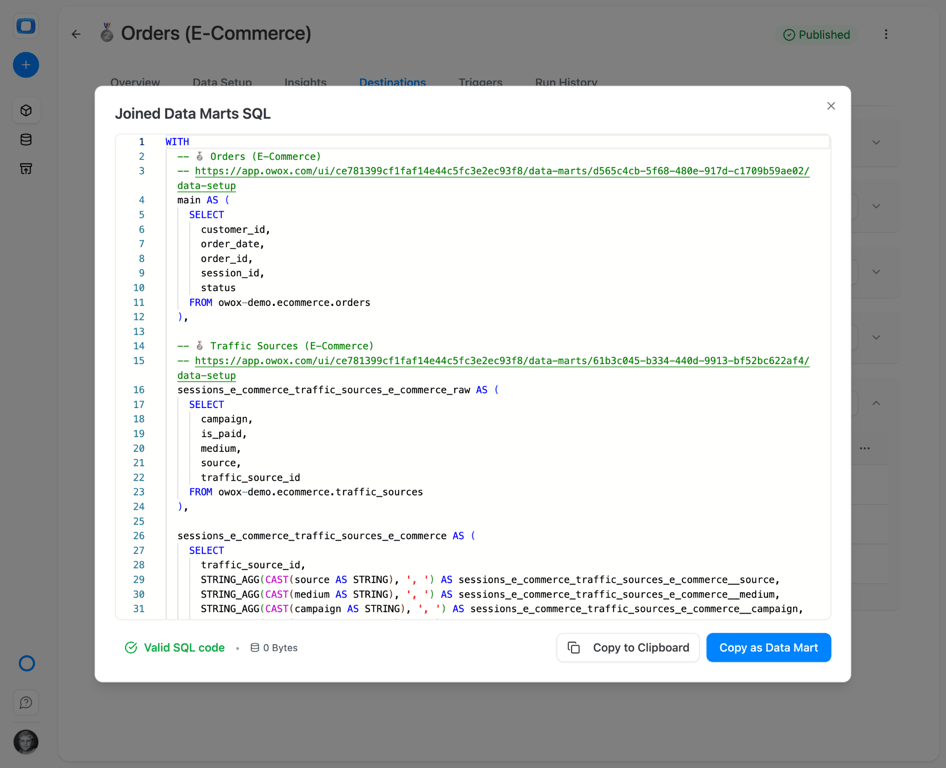
Start with a few data marts. Join them. Self-service in 5 minutes.
Start with a few data marts. Join them. Self-service in 5 minutes.
You don’t need to boil the ocean. Start with the entities your team already asks about every week.
Ecommerce example: Create three data marts – Products, Orders, Customers. Join them on shared keys (order_id, customer_id). Now any stakeholder can pull “revenue by product category for returning customers last quarter” without writing SQL or filing a ticket. Three data marts, joined – and an entire class of ecommerce questions is self-served.
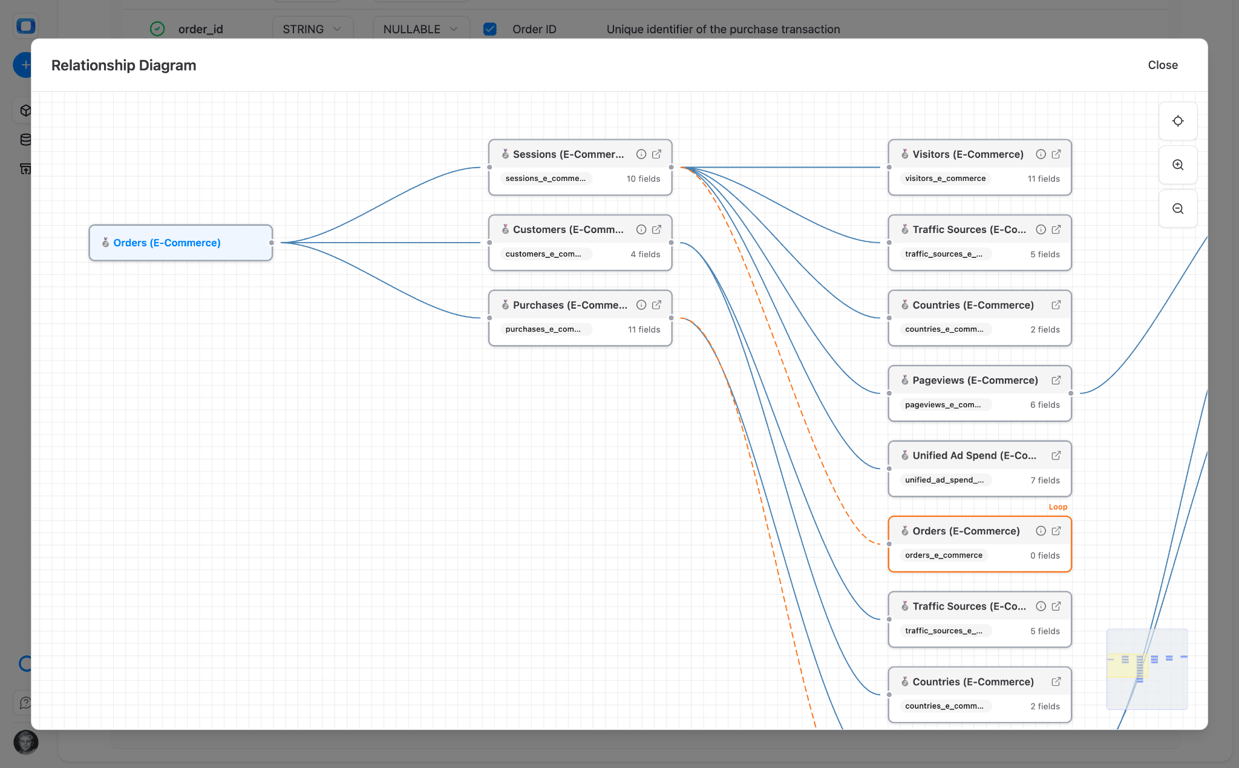
Marketing example: Sessions, Pageviews, Pages, Visitors, Users, Customers, Events. Join them on user_id and session_id. The marketing team stops asking “can you pull traffic by landing page with conversion?” – they pull it themselves from joined data marts in Google Sheets.
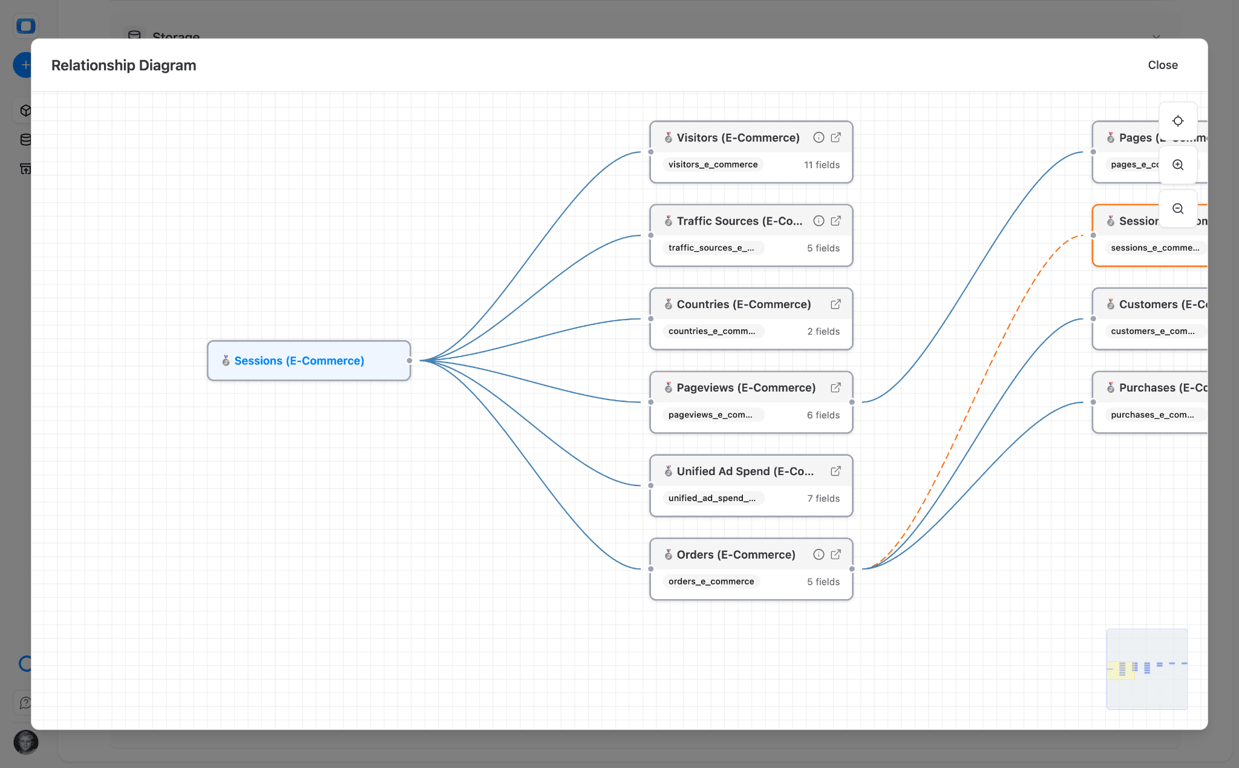
The power isn’t in one data mart – it’s in the joins. When the analyst defines how Products relates to Orders relates to Customers, every downstream question that crosses those entities is answered automatically. Each join multiplies the number of questions that are self-servable.
Most teams find that 3–5 joined data marts clear 40–60% of the backlog – because the most-requested reports are just different views of the same underlying entities. “Revenue by channel,” “revenue by region,” “revenue by product” – all answered by the same joined data mart library.
The ROI math: If each ad-hoc request takes 2–4 hours, and your top 5 entity groups generate 80% of the requests, a joined data mart library saves your team 20–40 hours per week. That’s a full-time analyst’s worth of capacity – without hiring. The automated reporting layer pays for itself before the first month ends.
That’s what it means to kill the backlog without adding headcount. The analyst’s role doesn’t shrink – it shifts from delivery to architecture. From “can you pull this?” to “let me design the system that answers every version of that question automatically.”
Start free → Build your first joined Data Mart library and watch the backlog empty itself.
FAQ
How do I convince my CEO we don't need to hire another analyst?
Show the math: count the top ad-hoc request categories and the hours each takes. Then demonstrate that a joined data mart library covering those categories saves 20–40 hours per week — the equivalent of a full-time hire. The argument isn't 'we don't need analysts' (you do). It's 'our current analysts should spend time on metric definitions and variance diagnosis, not on exporting CSVs.'
What is the difference between a data mart and a dashboard?
A dashboard is a pre-built view of data — it shows answers to questions someone anticipated. A data mart is the reusable dataset underneath: the governed, analyst-defined artifact that can power dashboards, spreadsheets, Slack insights, and any other destination. Business users can explore a data mart with filters and column selection, answering questions the dashboard designer never anticipated.
Does a data mart library work for small data teams?
Especially for small teams. A 2–3 person data team has the tightest capacity constraints — they can't absorb a growing backlog by hiring. A data mart library gives them leverage: define the logic once, publish it, and let stakeholders self-serve. The smaller the team, the higher the ROI of removing manual delivery from their workload.
Can business users create their own data marts?
No — and that's by design. Analysts define the SQL, the output schema, the join keys, and the access controls. Business users can only browse, filter, and pull from what the analyst made available. This separation is what makes the system governed: the data team controls the truth, the business user controls the question. No rogue spreadsheets, no conflicting metrics.
Should I hire another data analyst or automate reporting?
Hiring adds capacity, but demand grows to match it — every new analyst who publishes reports creates new consumers who ask for refreshes and variations. The more cost-effective approach is automating the delivery layer: build a governed data mart library that lets business users self-serve. The ROI math: if each ad-hoc request takes 2–4 hours and your top entity groups generate 80% of requests, a data mart library saves 20–40 hours per week — a full analyst's worth of capacity.
How many ad-hoc requests can one data mart eliminate?
A single data mart eliminates an entire category of requests, not just one ticket. For example, a 'Revenue by Channel' mart covers every variation — by region, by quarter, by product — because the business user filters and selects columns themselves. Most teams find that 3–5 joined data marts (e.g., Products + Orders + Customers) clear 40–60% of their total backlog because the most-requested reports are different views of the same underlying entities.
How do I reduce ad-hoc reporting requests to my data team?
Process fixes like intake forms and Scrum help triage but don't reduce volume. The structural fix is a governed data mart library: analysts define reusable datasets once, and business users self-serve from them in Google Sheets. Each data mart eliminates an entire class of requests — not one ticket, but every variation of that question. Most teams find that 3–5 joined marts clear 40–60% of their backlog.
Topics
About the author

Related articlesSee all articles →