
Solution
NewOWOX MCP — your financial metrics, narrated and delivered to your LLM
One definition of revenue. Every department. Every report.
Marketing says $2.1M. Finance says $1.8M. Both are pulling from different sources with different definitions. OWOX creates one governed source of truth — every metric defined once, every team pulling from the same Data Mart, every number traceable to SQL your analyst approved.
The analytics system teams use
Marketplace users
175K+
teams running OWOX from the Google Workspace Marketplace
G2 rating
4.9
296 verified reviews on G2
Connector downloads
156K+
open-source connector installs via npm
GitHub stars
231
the platform is open source — star it, fork it, self-host it
The reconciliation problem
You spend more time reconciling numbers than analyzing them
Every board meeting starts with "whose numbers are right?" Every budget cycle requires three weeks of data cleanup. Every new report creates another version of "revenue." It’s not a people problem — it’s a definitions problem. And it’s solvable.
How financial data works today
Multiple definitions, multiple truths
- Marketing, finance, and sales each report different revenue — none matching
- Every department builds metrics in their own spreadsheets — impossible to audit
- Board decks require a reconciliation sprint before every meeting
- AI tools hallucinate financial metrics — and nobody catches it until the board
- Nobody can trace where a number came from without asking three people
With OWOX
One definition. Every team. Every report.
- Every metric defined once — one SQL definition, one owner, one description
- Every team pulls from the same governed source — same number, always
- Full audit trail from board slide to warehouse query
- AI financial briefs with deterministic numbers — no hallucinations
- Board prep takes minutes — reconciliation happened at the source
Numbers reconcile across every report because the definition lives in one place. That’s it. That’s the fix.
F04 · Governed metrics
Define revenue once - use it by everyone
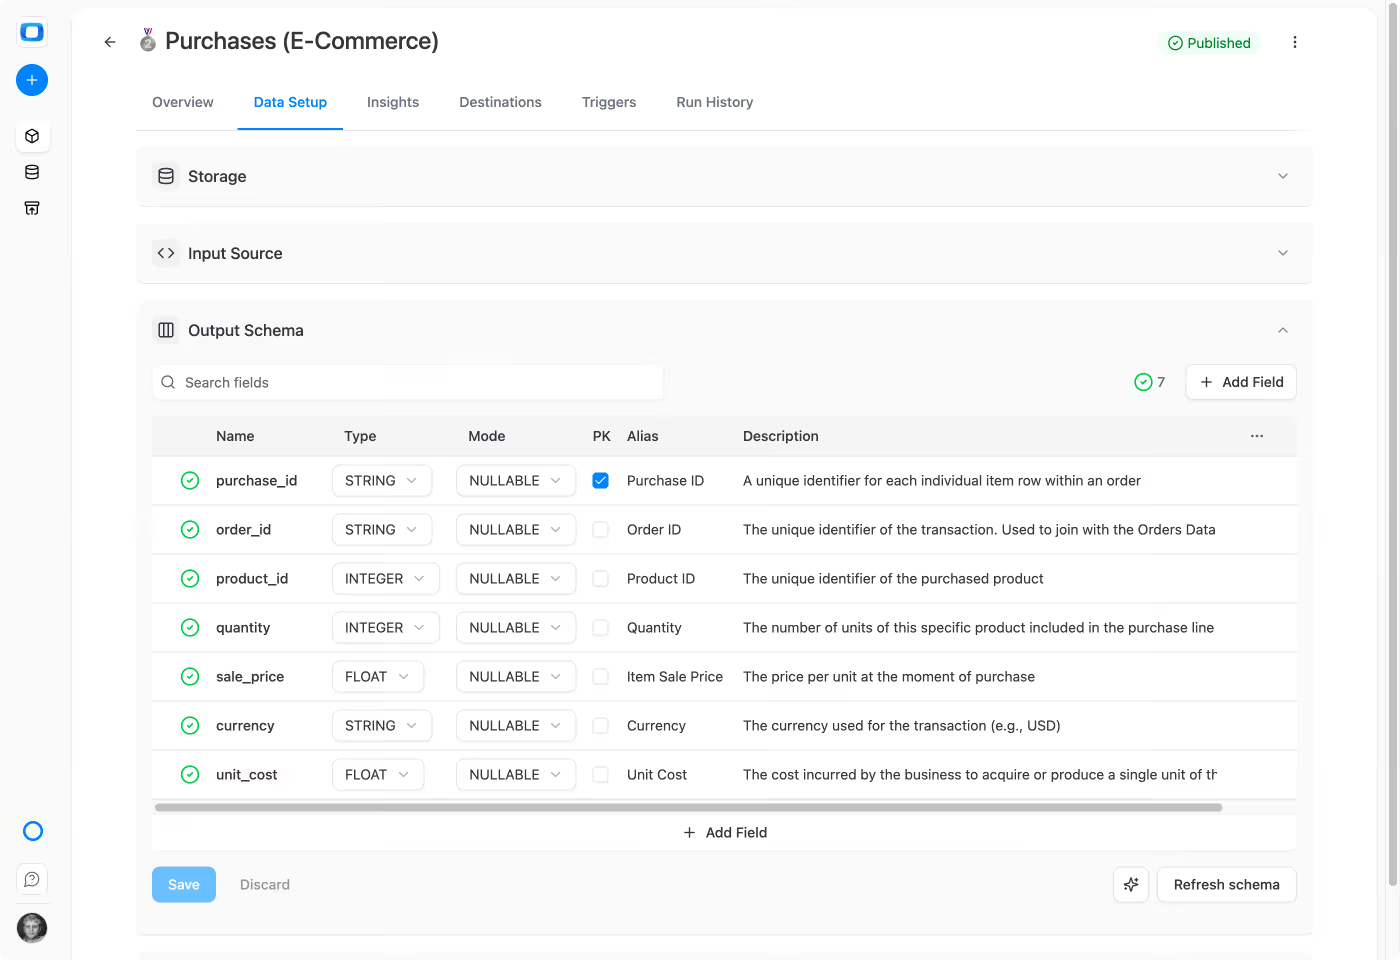
Your data team defines each financial metric once. That definition gets published to the library. Every team pulls from it. Done.
- One SQL definition per metric — versioned, owned, documented
- Business-friendly aliases — "Net Revenue (excl. refunds)" not "rev_net_v3_final"
- Technical Owner + Business Owner on every governed metric — clear accountability for every number
F05 · Self-servICE
Your FP&A team self-serves — here’s how.
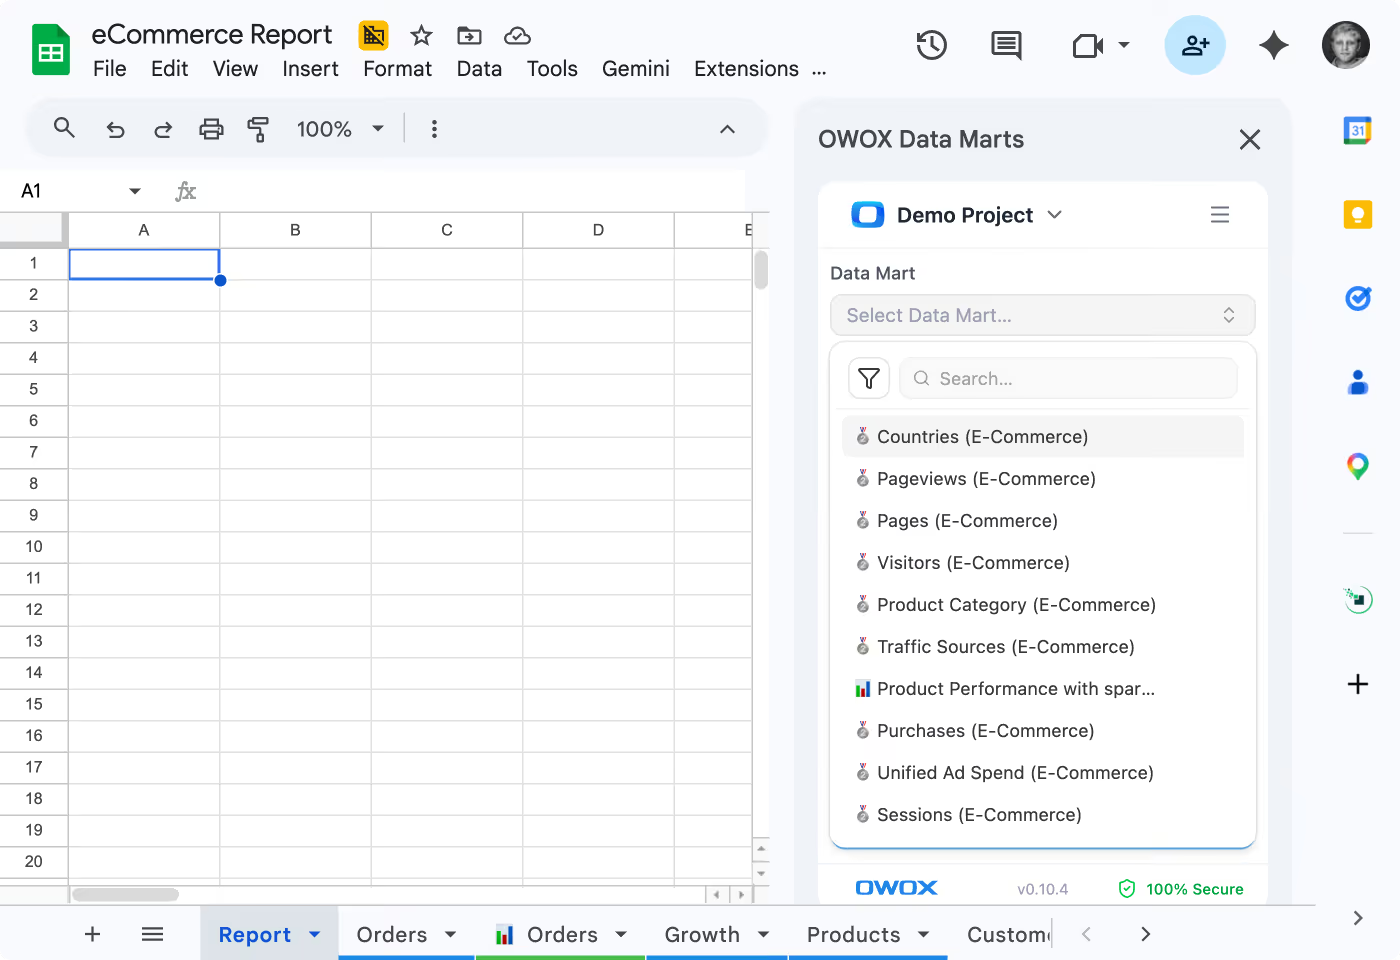
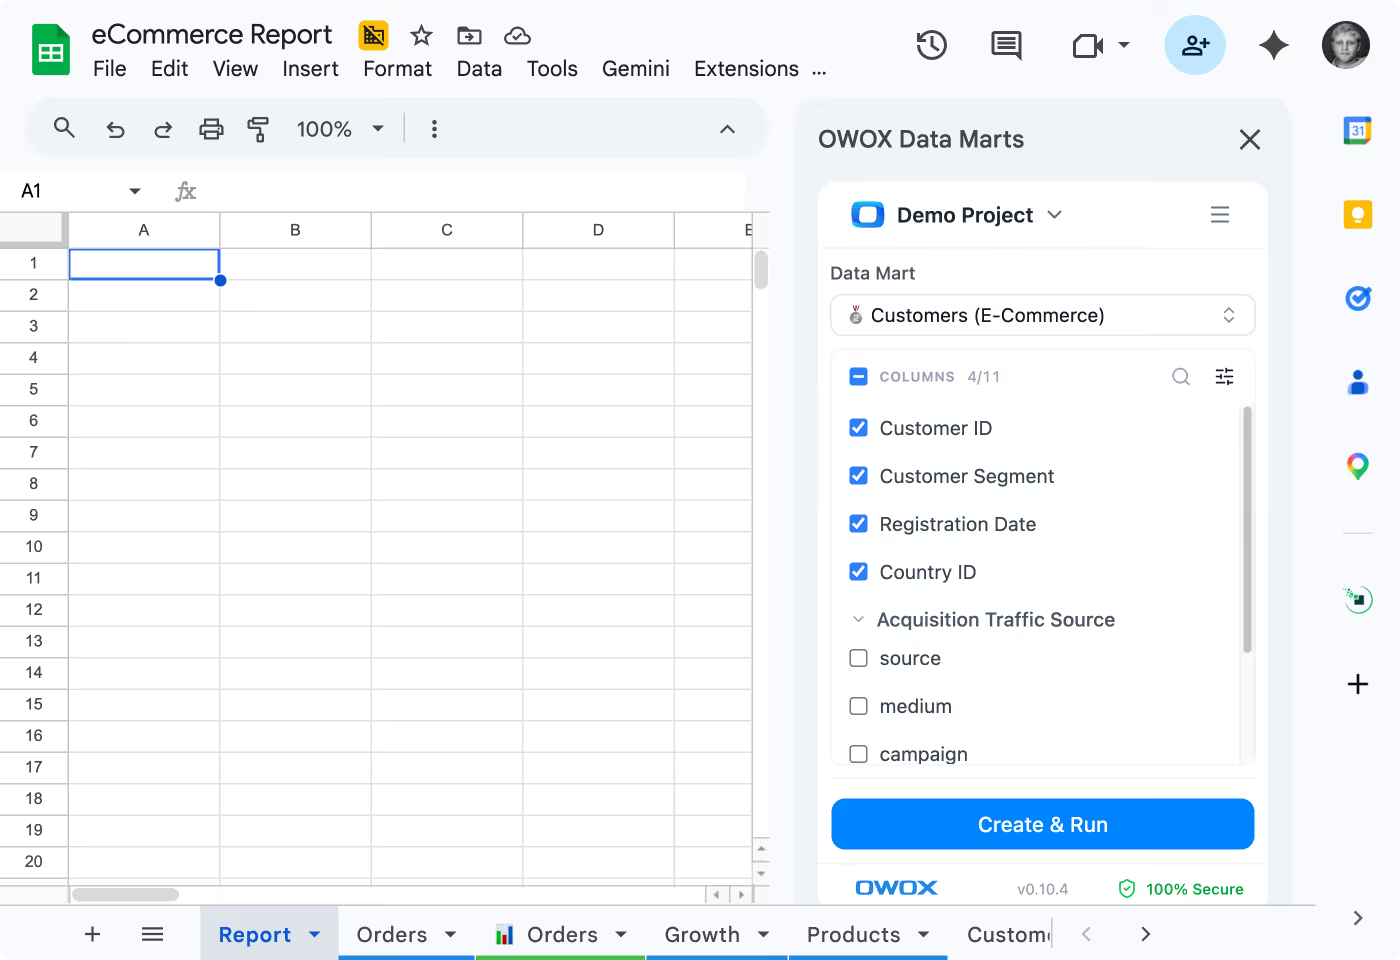
Your finance team browses the governed metric library in Google Sheets, picks columns, and refreshes — every cell traceable to the SQL definition and the owner who approved it.
- Column picker shows governed financial metrics — "Gross Margin," "CAC," "LTV"
- Full audit trail — every cell traces to the SQL query, the governed metric definition, and the owner who approved it
- Deterministic results — same query, same number, every time. Patented technology, zero hallucinations
F06 · Board-ready briefs
Board prep that writes itself.
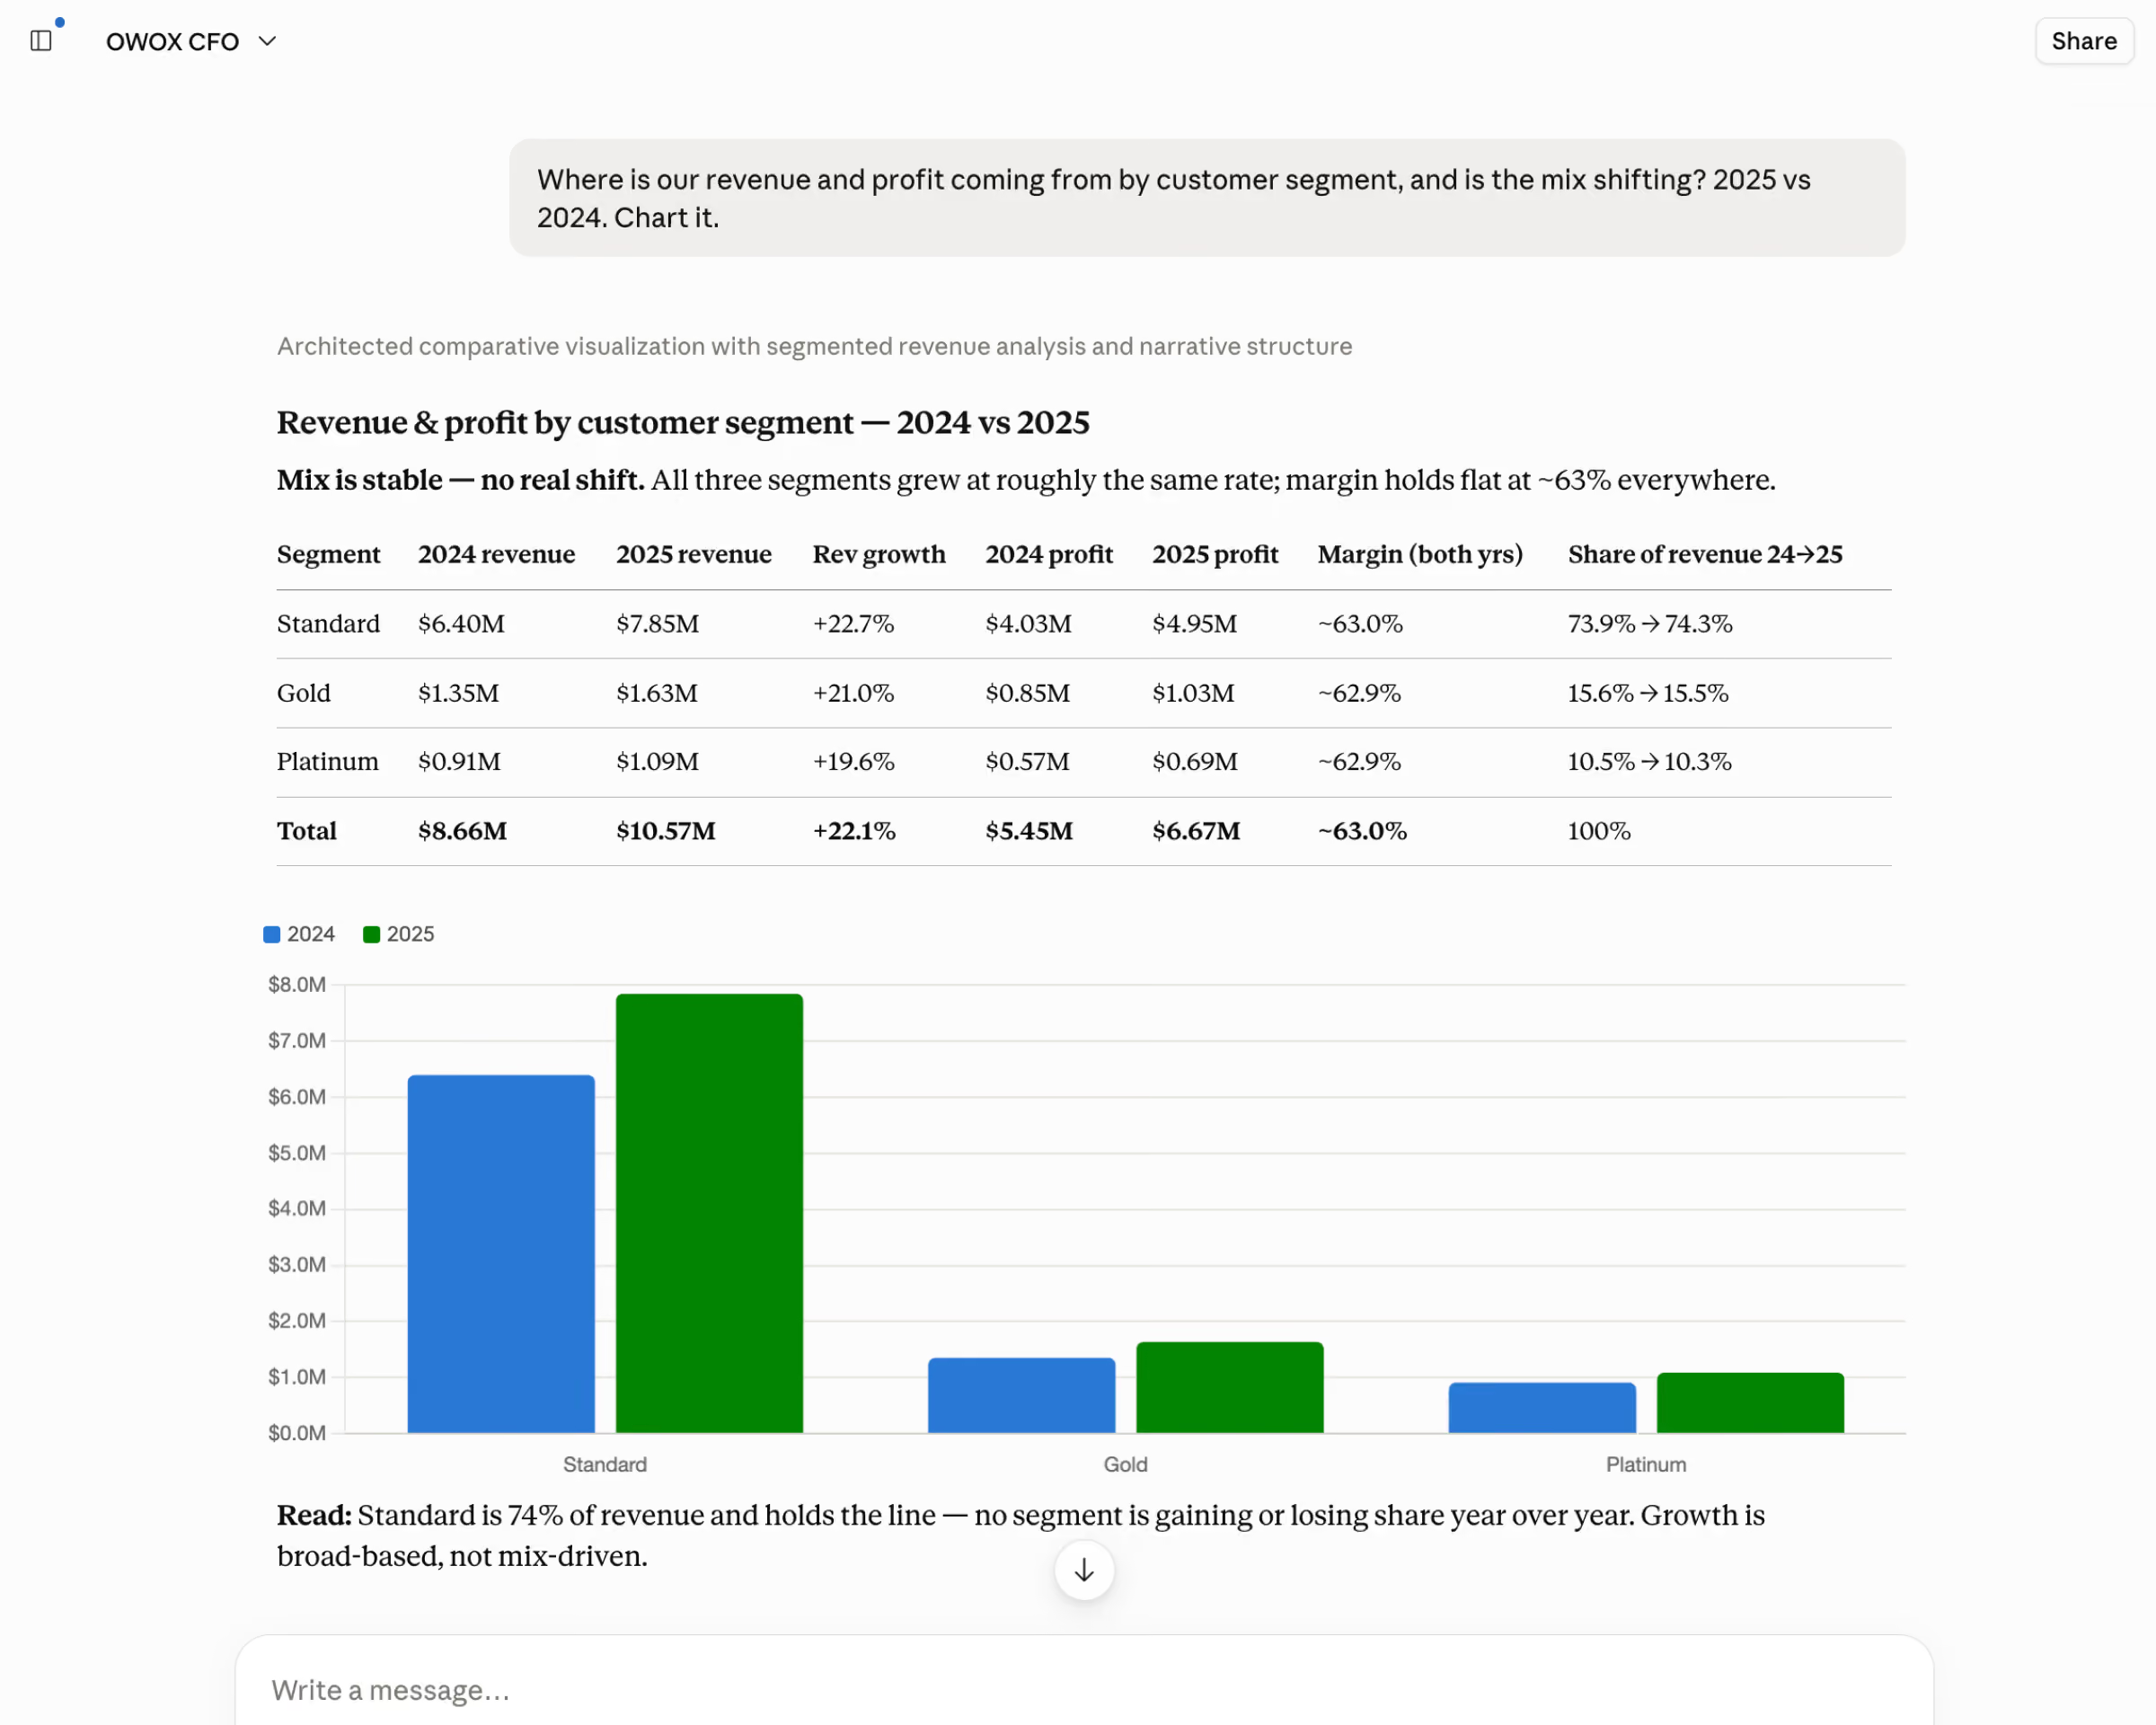
OWOX turns your governed financial metrics into a written executive summary — the P&L story, the trend, the takeaway — right inside Claude or ChatGPT, on the schedule you set. You walk into the board with the narrative already done.
- Scheduled and delivered
- Every number comes from a deterministic SQL query
- Patented:
F07 · OWOX MCP
Board prep, on demand. Ask in your own AI chat.
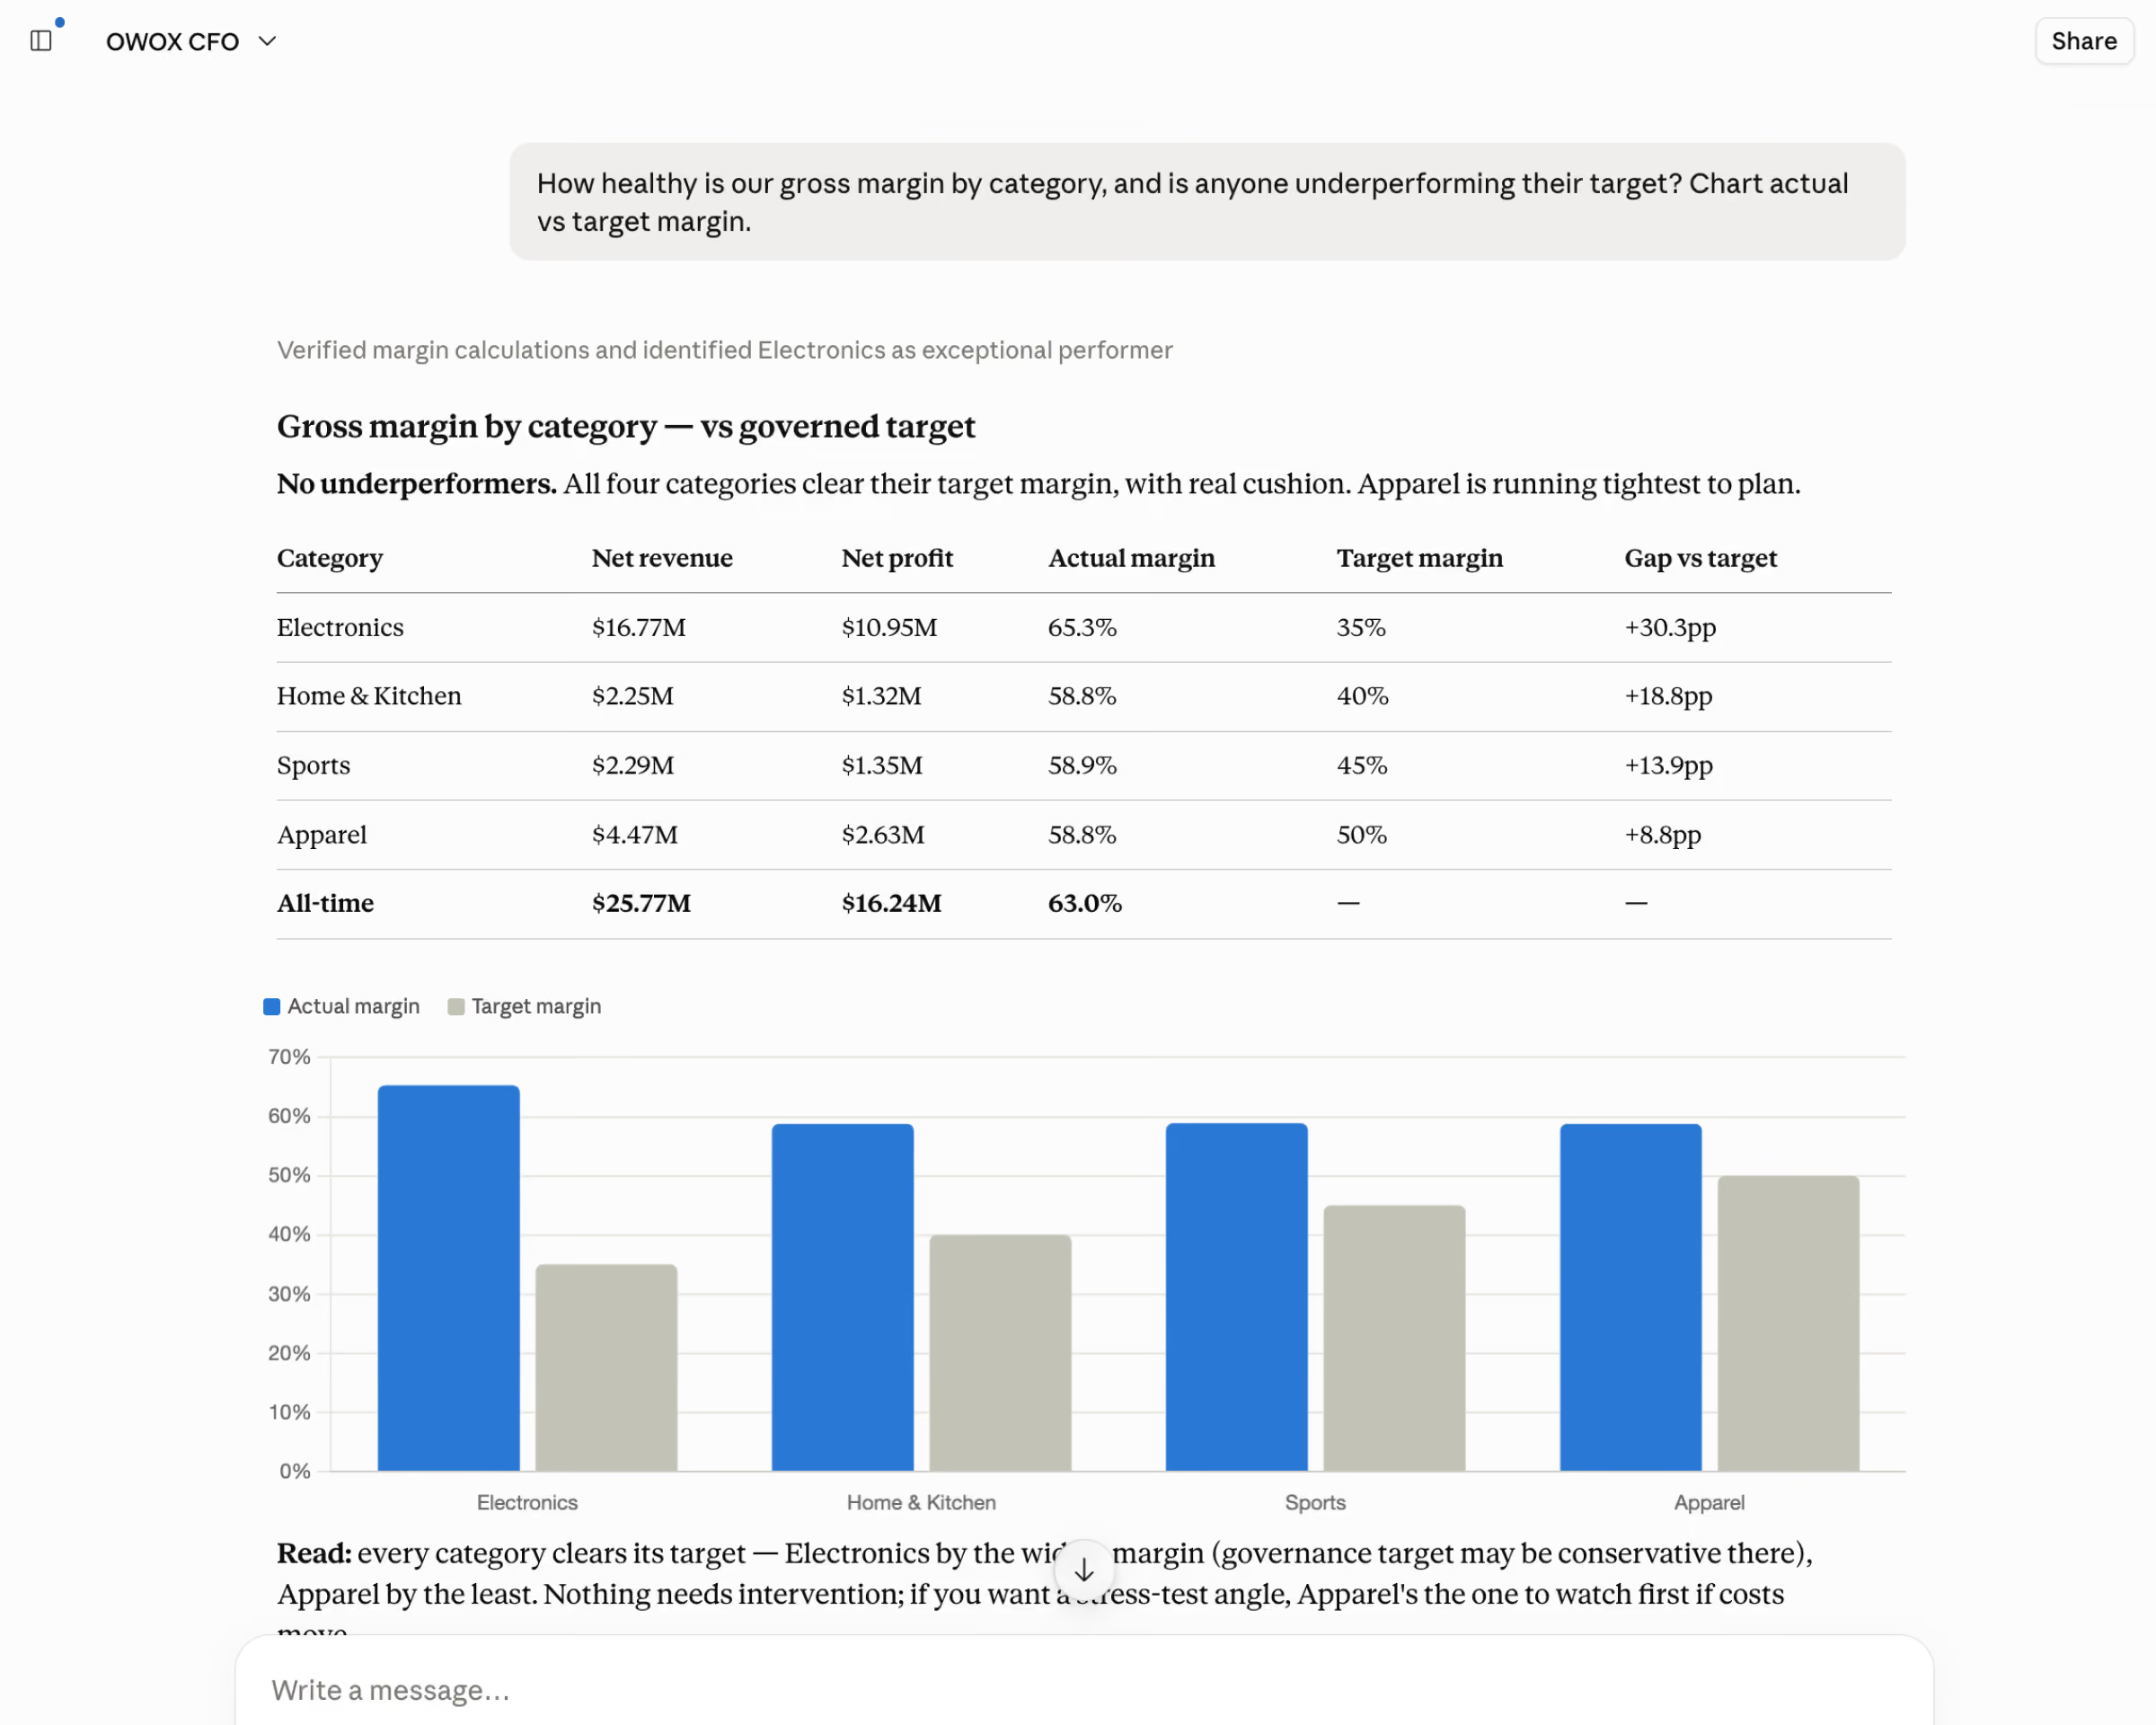
Ask in Claude or ChatGPT: "Q3 revenue vs plan by segment?" You get a board-ready number with the audit trail attached — every figure computed by analyst-approved SQL, never estimated by the model. This is MCP.
- Every answer traces to the same governed definition your board deck uses — no reconciliation surprise in the room.
- Zero hallucinations: the model narrates, deterministic SQL computes. Patented.
- Auditable: every AI query is logged in Run History — you can prove where the number came from.
How it works
From chaos to one source of truth in 3 steps
Your data team defines the metrics. Every team self-serves. AI delivers financial briefs. The reconciliation problem disappears because you eliminated the root cause: multiple definitions.
Step 1
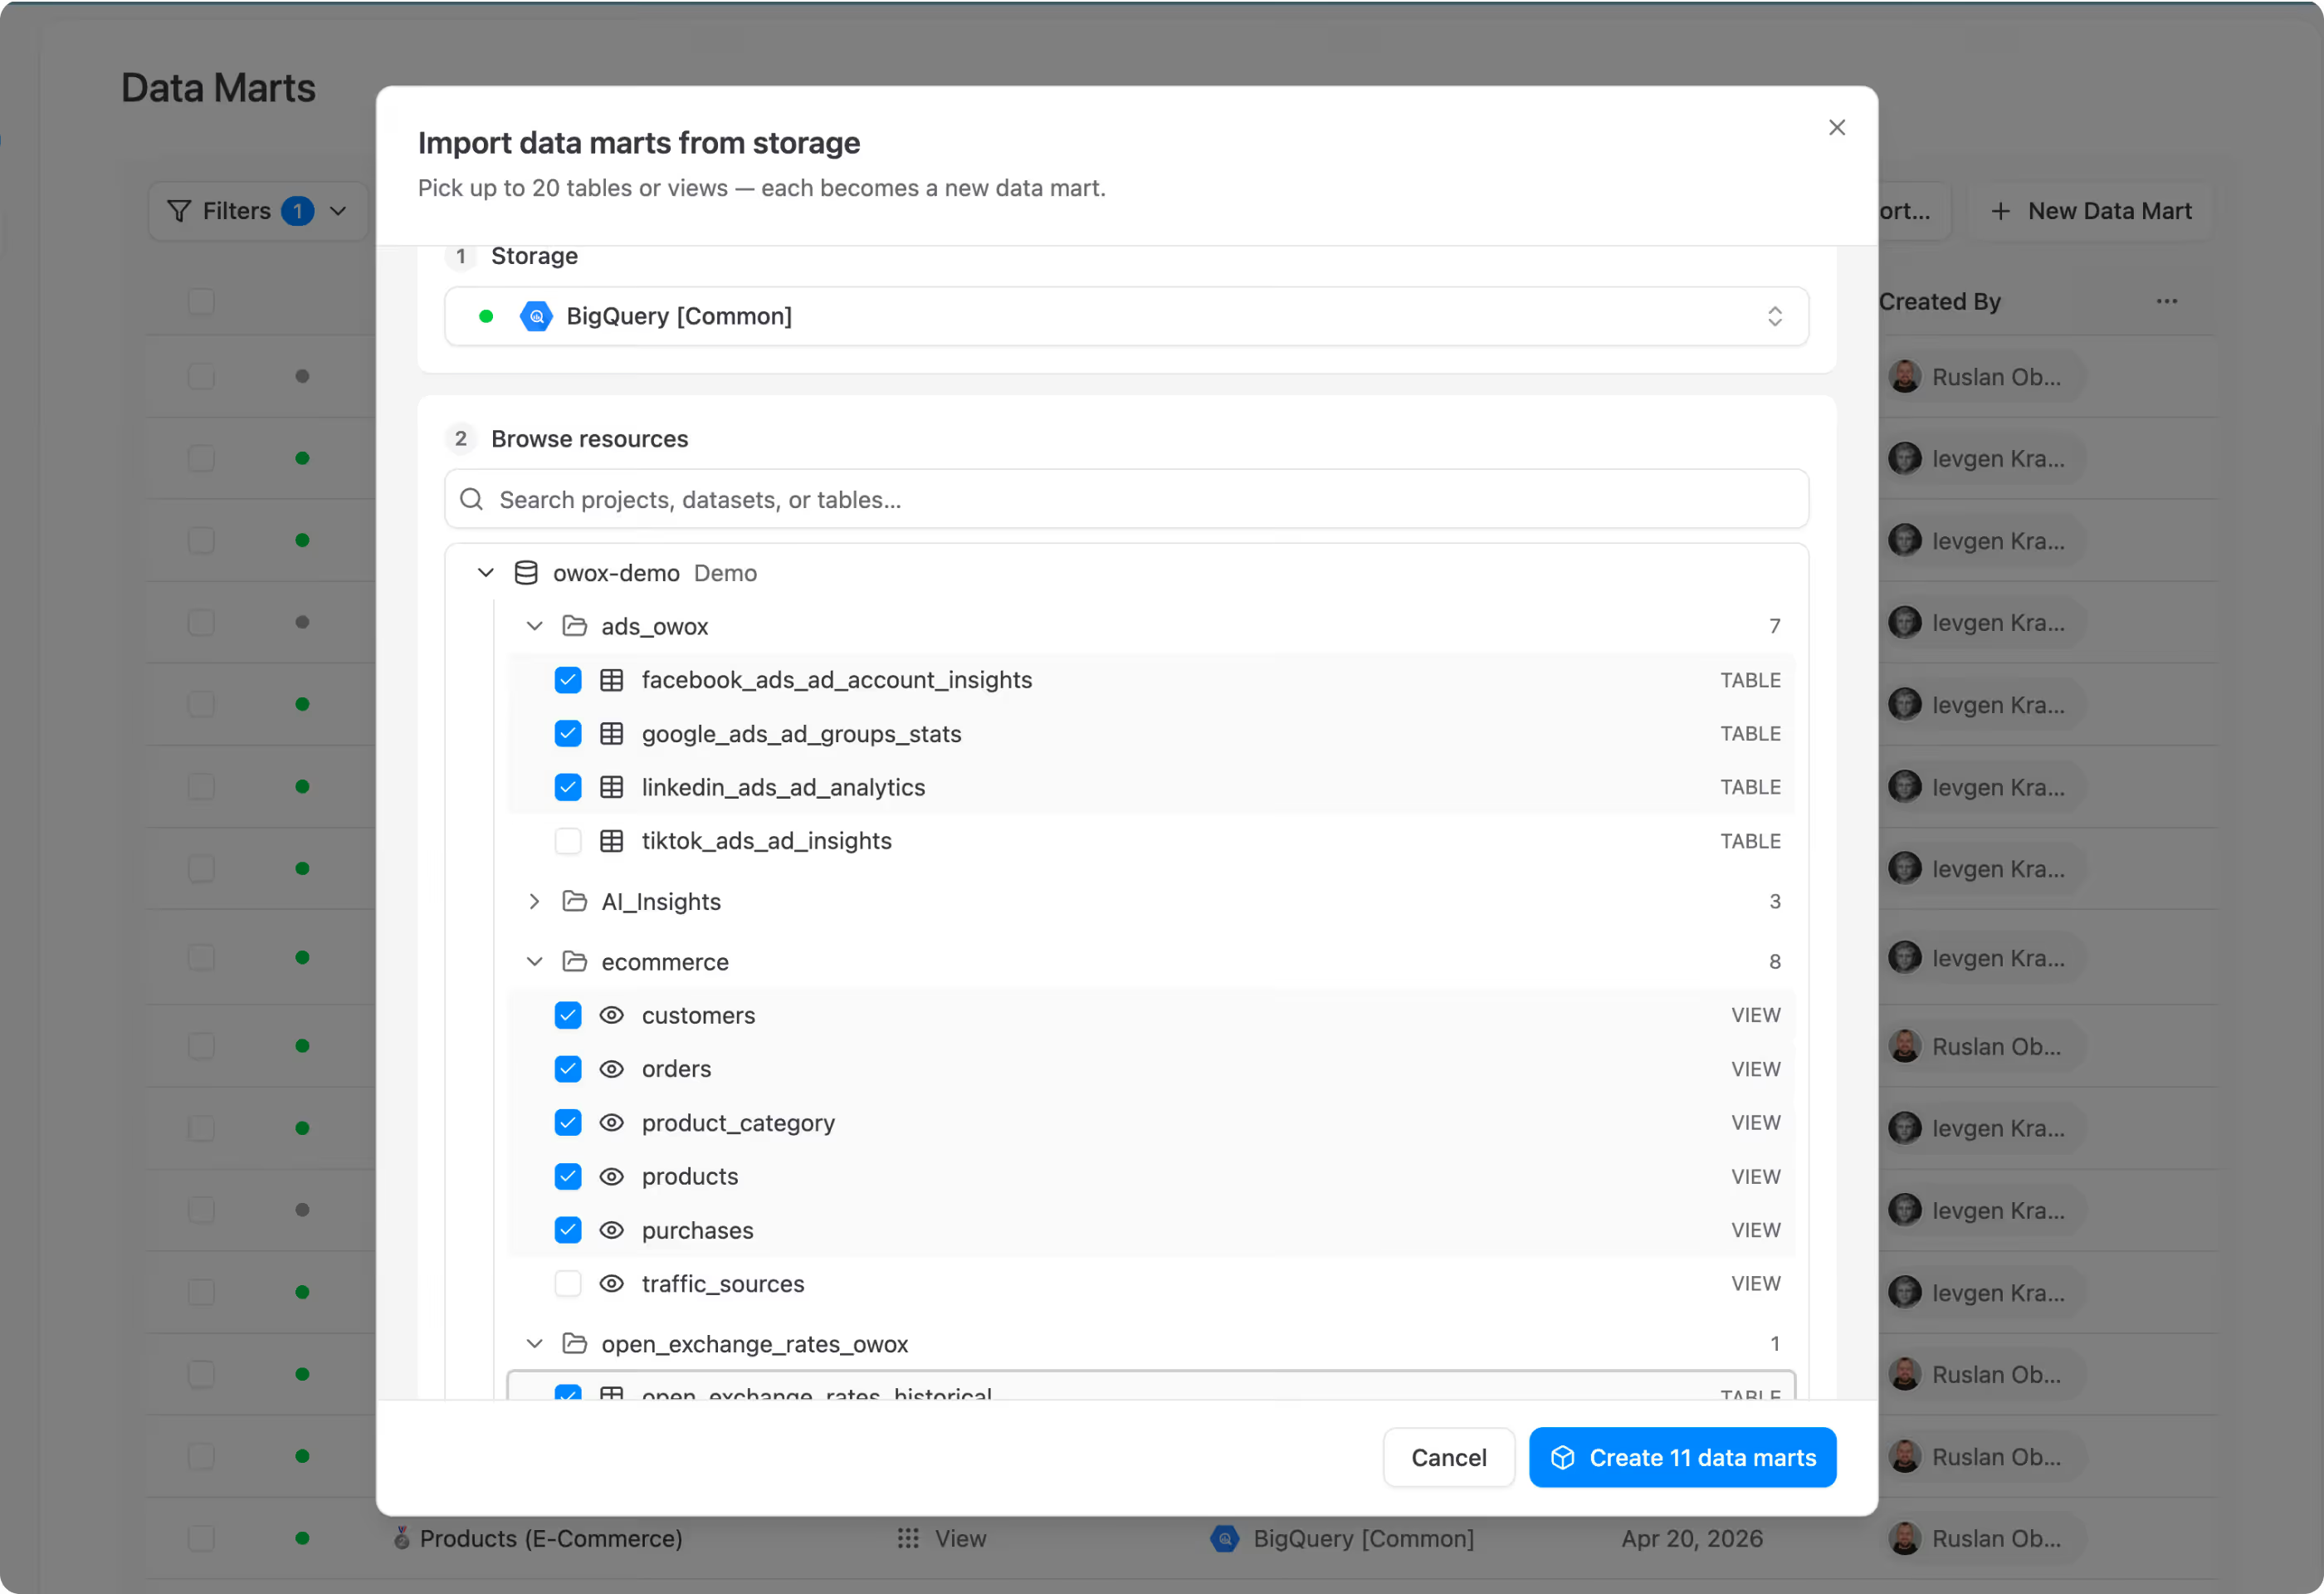
Data team defines the metrics
Each metric gets one SQL definition, one owner, one description. "Revenue" means the same thing everywhere.
Step 2
Every team self-serves
Marketing, sales, ops, and finance browse the same library in Sheets. No spreadsheet silos.
Step 3
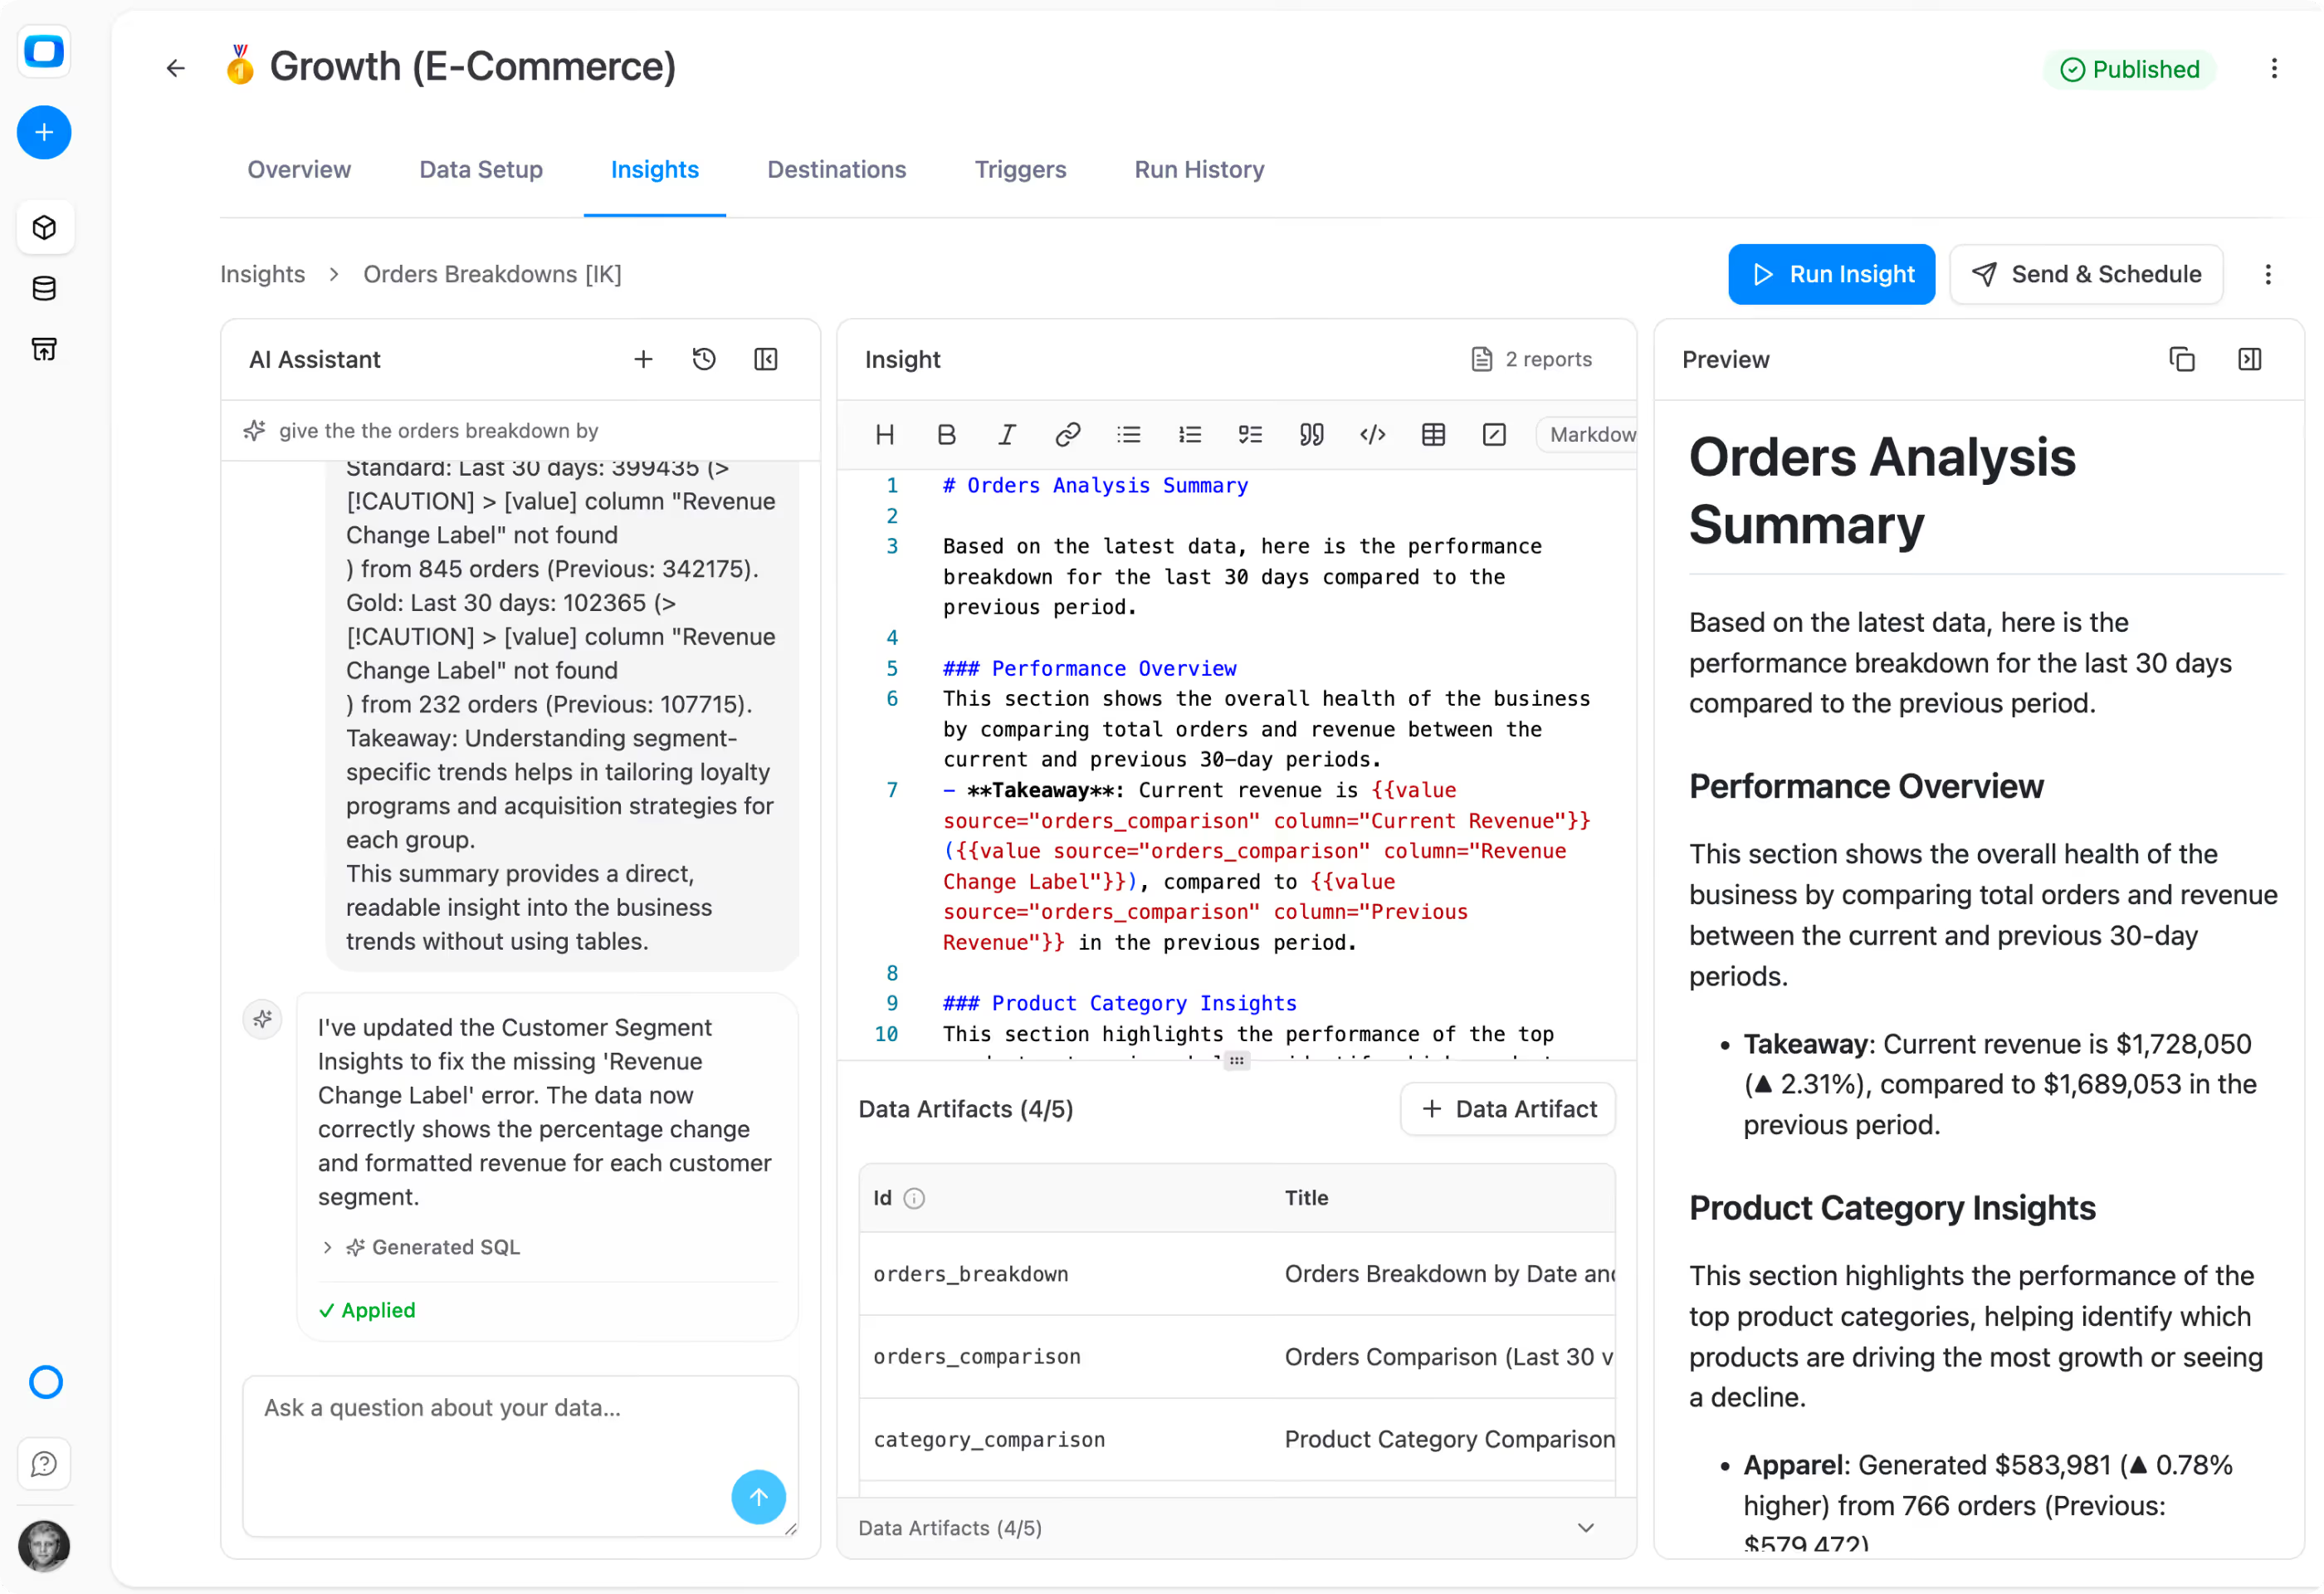
AI delivers board-ready briefs
Revenue trends, margin shifts, anomalies — delivered before every board meeting. Every number traceable.
What changes for your finance org
Numbers you can put on a board slide without a disclaimer
When every metric has one definition and one owner, the financial reporting workflow transforms.

Board prep in minutes
Revenue, margin, and CAC numbers are the same everywhere because they come from the same governed source. No reconciliation sprint.

Full audit trail, every cell
Regulators, auditors, your CEO — anyone can trace any number back, the definition, and the analyst who approved it. No black boxes.

Finance and marketing finally agree
When both departments pull "revenue" data from the same source, the $300K gap between their reports disappears.
What users are saying
What business leaders say
Real things real customers said — each quote pinned to a specific claim, straight from the quotes database.
 Nodari RizunFounder & CEO, Pürblack®
“We regained time. And time is the one resource that never comes back.”
 Mark SimmonsCMO, Pürblack®
“As a marketing leader, it's so refreshing to make decisions based on data and insights rather than guesses.”
Nodari RizunFounder & CEO, Pürblack®“We don't need to wait for a report anymore. We don't wait on an engineer or an account manager — within minutes we get data, make a decision, question it, and pivot.”
Customer stories
Organizations that ended the reconciliation problem
Finance teams that put one definition behind every metric
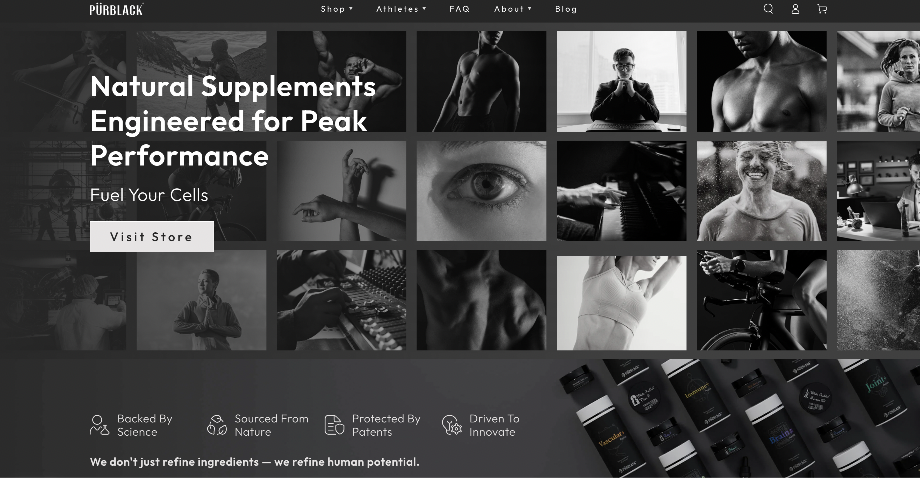 "For 10 years I was blind." The day Pürblack® founder stopped guessingSecondsto get reports across six channelsRead the story
  How OWOX Reports Helped Reformation Make Data-Backed DecisionsMinutesfrom data request to business decisionRead the story
  How OWOX Reports Streamlined Operations for WorkSimpli, Saving Over 10 Hours Weekly10hrs+saved per week on manual reportingRead the story
 WHAT YOUR DATA TEAM DEPLOYS
One governed source. Built by the analyst your data team hires.
Your data team sets up a Reporting Analyst once: it defines each financial metric as a governed source — one SQL definition, one owner, full lineage. When leaders want to ask "why did margin slip in EMEA?" in plain language, the Senior Analyst answers in Slack or your AI assistant, traceable to SQL. For audit, SSO, and compliance at scale, that's Enterprise.

Reporting Data Analyst
Answers questions with data in spreadsheets. Delivers the same metrics across teams.

Senior Data Analyst
Answers your “why” questions in plain language — @owox in Slack, Claude, ChatGPT. Traceable to SQL.
FAQ
Questions finance leaders ask
How does OWOX eliminate the reconciliation problem?
The reconciliation problem exists because different teams define the same metric differently — marketing calculates revenue from ad conversions, finance from the ERP, sales from CRM close dates. OWOX solves this by creating one governed Data Mart per metric. "Revenue" gets one SQL definition, one owner, one description of what’s included and excluded. When marketing, finance, and sales pull revenue data in Google Sheets, they all pull from the same Data Mart. Same definition, same SQL, same number. The gap doesn’t need to be reconciled because it doesn’t exist — you eliminated it at the source. If someone needs a different cut (revenue by region, revenue excluding refunds), they use the column picker to add filters or join another Data Mart — but the base definition stays the same.
Can I trust AI-generated financial summaries?
You can’t trust ChatGPT with financial data — that’s true. An LLM generating SQL on the fly will join the wrong tables, confuse gross and net revenue, and give you a different number every time you ask. One bad number in a board deck can cost you credibility that takes quarters to rebuild. OWOX Insights work differently. Your analyst writes the SQL for each financial metric and publishes it as a Data Mart. The AI Insight runs that pre-approved SQL, computes the exact numbers, and then uses AI to write the narrative commentary around them — "Gross margin improved 2.3pp MoM, driven by reduced COGS in the electronics category." The 2.3pp is deterministic — same SQL, same warehouse, same number every time. AI writes "improved" and "driven by" — the editorial glue. Patented technology.
Does this work with our existing ERP and accounting systems?
OWOX connects to the data warehouse where your ERP data lands — BigQuery, Snowflake, Databricks, Redshift, or Athena. Most finance teams already have ERP data replicated to a warehouse via Fivetran, Stitch, or native ERP exports. OWOX doesn’t replace that pipeline — it sits on top of it. Your analyst wraps the ERP tables as Data Marts, defines aliases and join keys, and publishes them. If your ERP data isn’t in a warehouse yet, that’s the first step — but it’s a one-time setup, and tools like Fivetran make it straightforward. Once the data is in the warehouse, OWOX makes it self-serve for your entire finance team.
What audit trail does OWOX provide?
Every Data Mart has a complete run history — who triggered it, when it ran, whether it succeeded, how long it took, and what SQL executed. Every cell in every report traces back through the Data Mart to the SQL query that produced it. Technical Owner and Business Owner are assigned to every metric. For enterprise customers, OWOX adds monitoring, logging, and role-based access controls — so you can prove to auditors exactly who sees what data and how every number was computed. The audit trail goes from board slide → Sheets cell → Data Mart → SQL query → warehouse table. No black boxes anywhere in the chain.
How does this compare to building a semantic layer with dbt + Looker?
A semantic layer project with dbt + Looker is the gold standard for enterprise data governance — and it typically takes 6–12 months, requires dedicated analytics engineering headcount, and costs six figures in tooling. OWOX compresses this dramatically. Your analyst wraps existing dbt views as Data Marts in two clicks. OWOX auto-generates aliases, descriptions, join keys, and ownership. Business users self-serve in Sheets via the Google Sheets Extension — no Looker training, no explore-mode complexity. You get 80% of the semantic layer value in 5% of the time. And the two approaches aren’t mutually exclusive: if you already have dbt models, OWOX is the last-mile self-service layer that makes them accessible without Looker licenses.
What does this cost?
Cloud Starter is $30/month — that includes Data Mart management, the Google Sheets Extension, and Looker Studio destination. For a finance team that needs AI-narrated financial briefs, multi-destination delivery, and SLA, Team plans start at $875/month. Enterprise is custom pricing with SSO, RBAC, monitoring, and audit logging. For context: one reconciliation sprint before a board meeting typically burns 40+ analyst hours at $60–80/hour — that’s $2,400–$3,200 in analyst time, four times a year. OWOX eliminates that entirely by solving the root cause.