
Solution
NewThe OWOX MCP is live — ask in Claude & ChatGPT →
Pipeline numbers that reconcile. Forecast you can trust.
OWOX gives revenue teams direct access to governed sales data — pacing, growth rate, basket by segment — right from Claude or ChatGPT. One-click in Google Sheets. No lagging weekly decks. No promos that quietly lose money. No stalls you spot too late.
170,000+ users can't be wrong
Marketplace users
175K+
teams running OWOX from the Google Workspace Marketplace
G2 rating
4.9
296 verified reviews on G2
Connector downloads
156K+
open-source connector installs via npm
GitHub stars
231
the platform is open source — star it, fork it, self-host it
The pipeline trust gap
Your pipeline numbers don’t match. And everyone knows it.
Sales, marketing, and finance each have their own version of pipeline, attribution, and revenue. Your forecast lives in a spreadsheet nobody can audit. And when the board asks "are we going to hit the number?" — you’re not sure which pipeline to believe.
How sales data works today
Three systems, three truths
- CRM says $4.2M. Marketing says $3.1M. Finance says $2.6M. Which is the board number?
- Marketing delivered 500 MQLs. Sales says 200 were junk. Nobody can prove it.
- Forecast lives in a spreadsheet someone built 18 months ago — formulas broken
- RevOps spends 20 hours/week on pipeline snapshots and reconciliation
- Board asks "confidence on Q3?" — you answer on gut, not governed data
With OWOX
One pipeline. One forecast. One truth.
- CRM + marketing + revenue joined in one governed Data Mart
- MQL-to-revenue tracing — see which efforts actually drove closed deals
- Forecast built on governed data with deterministic SQL — auditable, owned
- Sales team self-serves in Sheets — filter by rep, region, or stage
- AI weekly brief — deal velocity, conversion, forecast confidence — to Slack
Pipeline numbers reconcile because CRM, marketing, and revenue data pull from the same governed source.
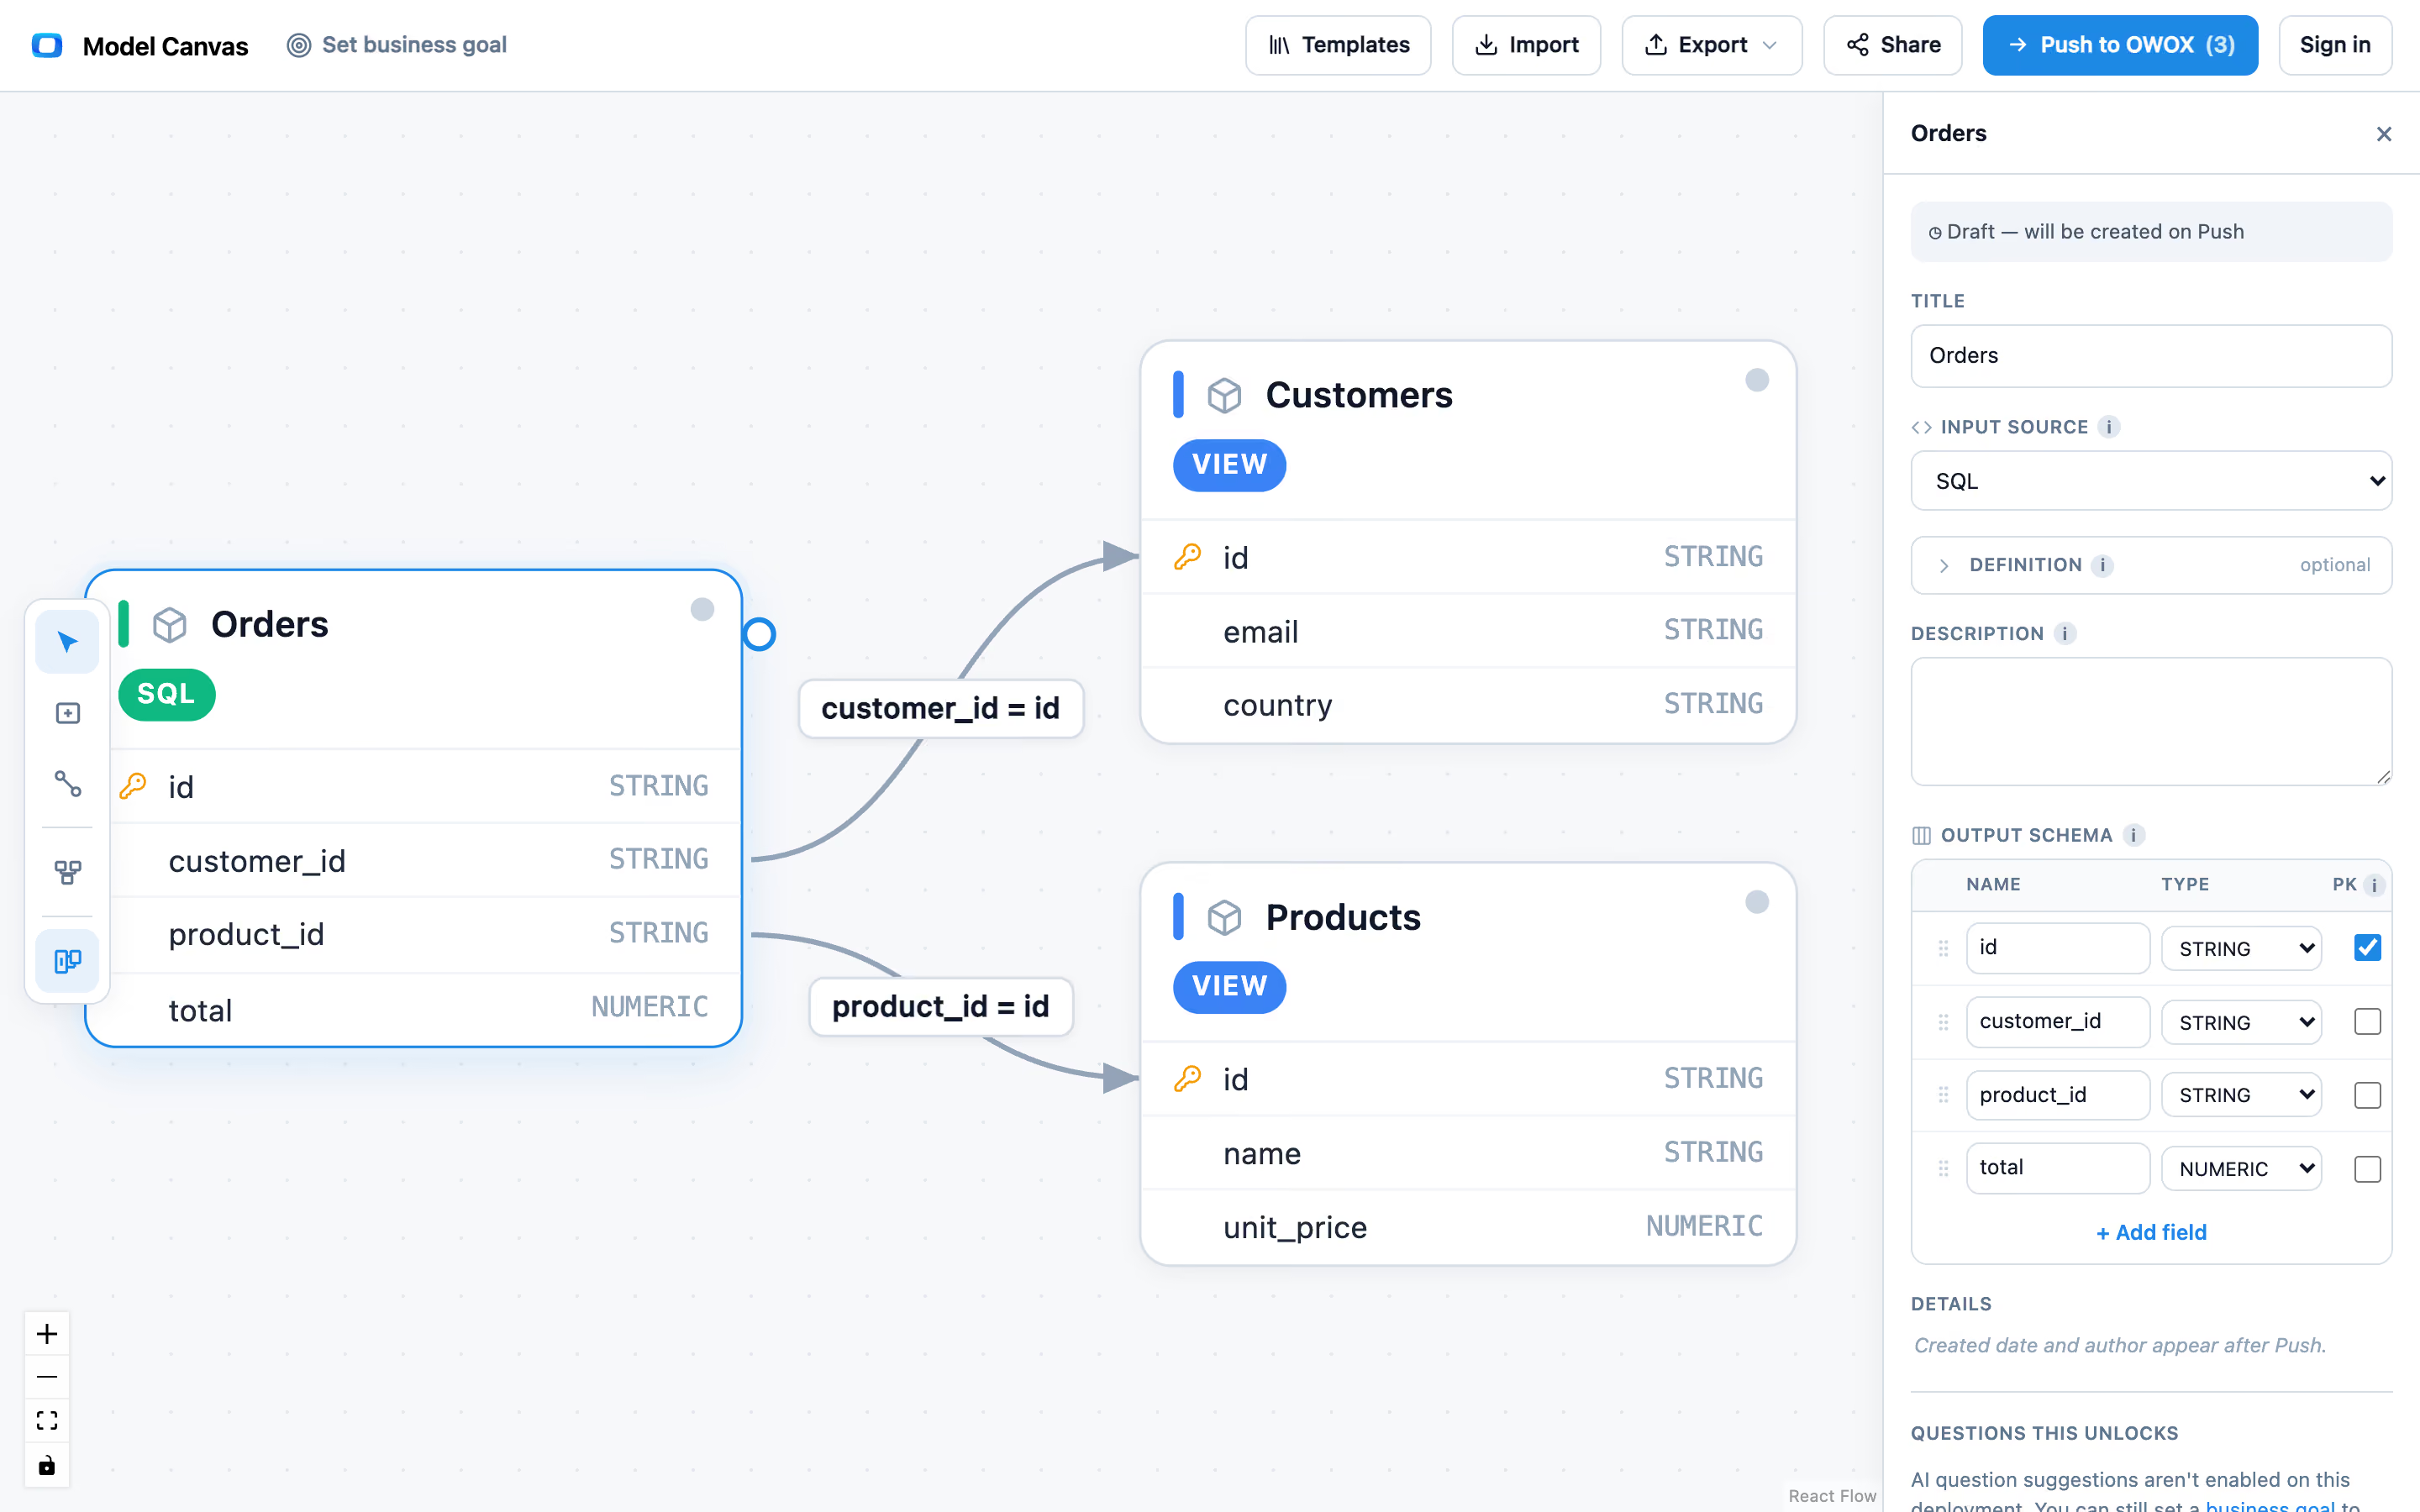
F04 · Joined pipeline data
CRM, marketing, and revenue — in one governed library
Your RevOps team joins CRM, marketing, and revenue data in the warehouse and publishes it as a governed library. One definition per metric. One source of truth.
- CRM pipeline + marketing spend + actual revenue — joined with analyst-defined keys
- One definition of "pipeline" across sales, marketing, and finance — no more reconciliation
- Technical and Business Owner on every Data Mart — clear accountability on every metric
F05 · Self-serve pipeline
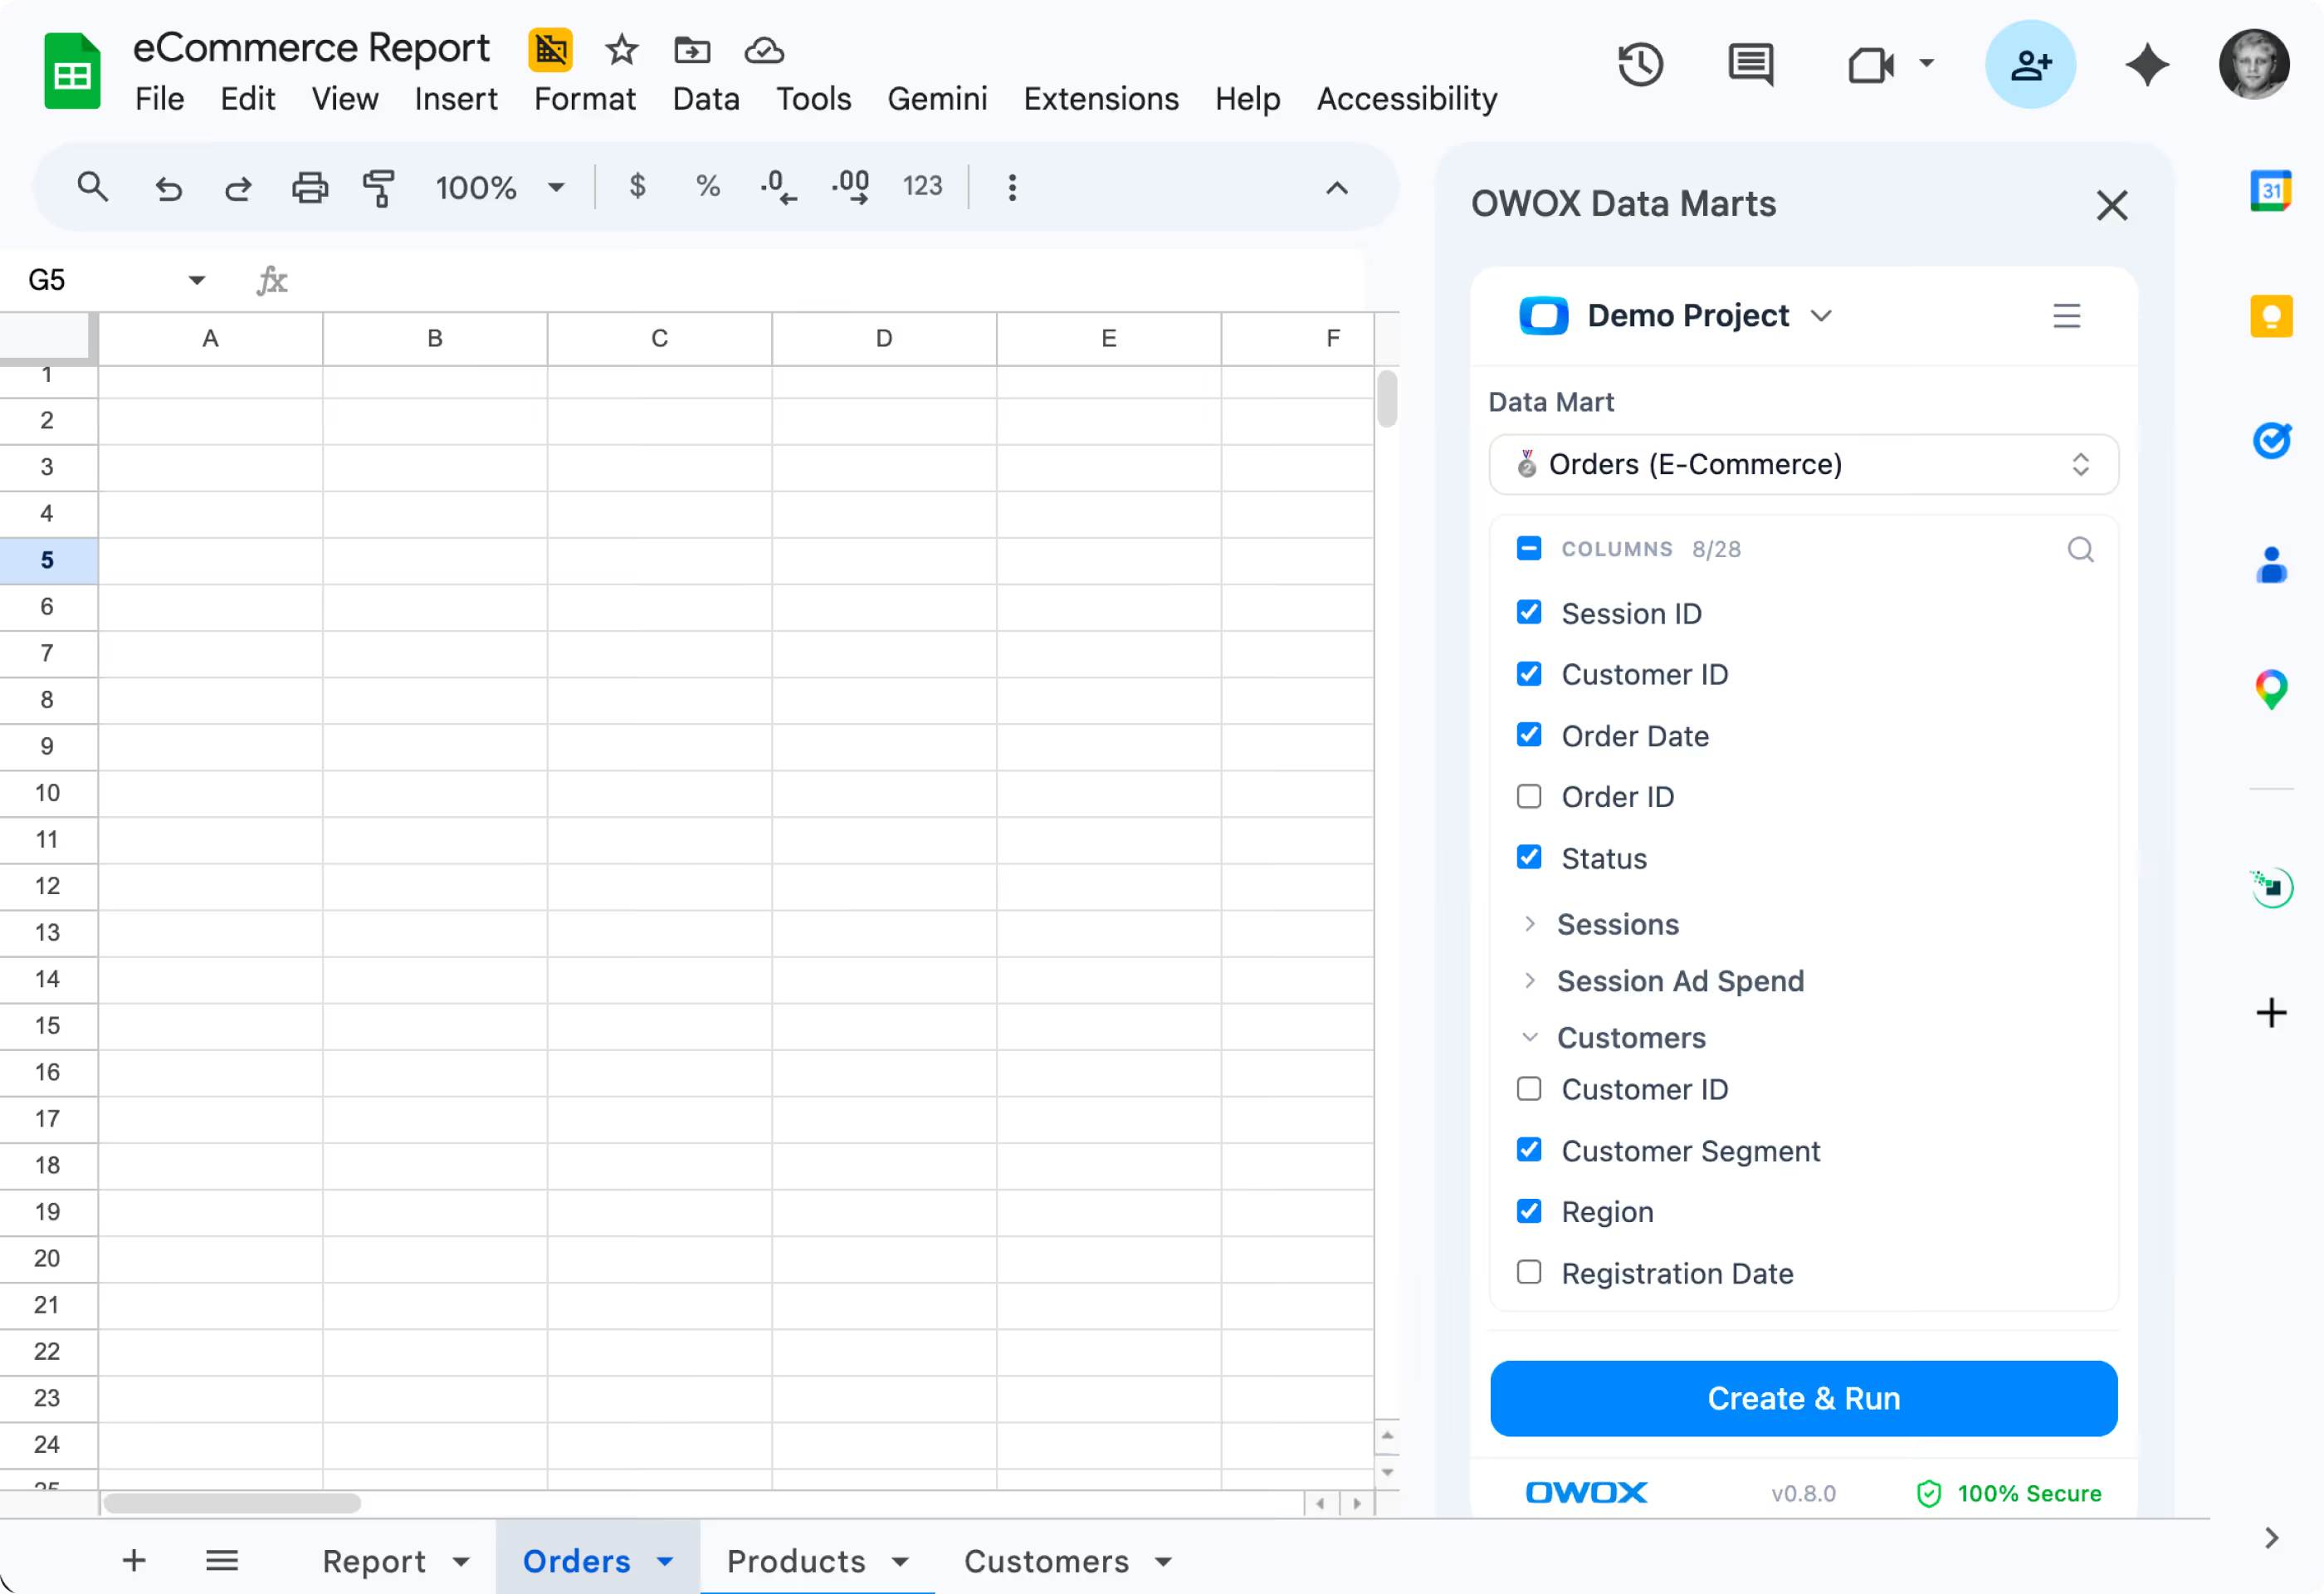
Your sales team filters by rep, region, or stage — without RevOps
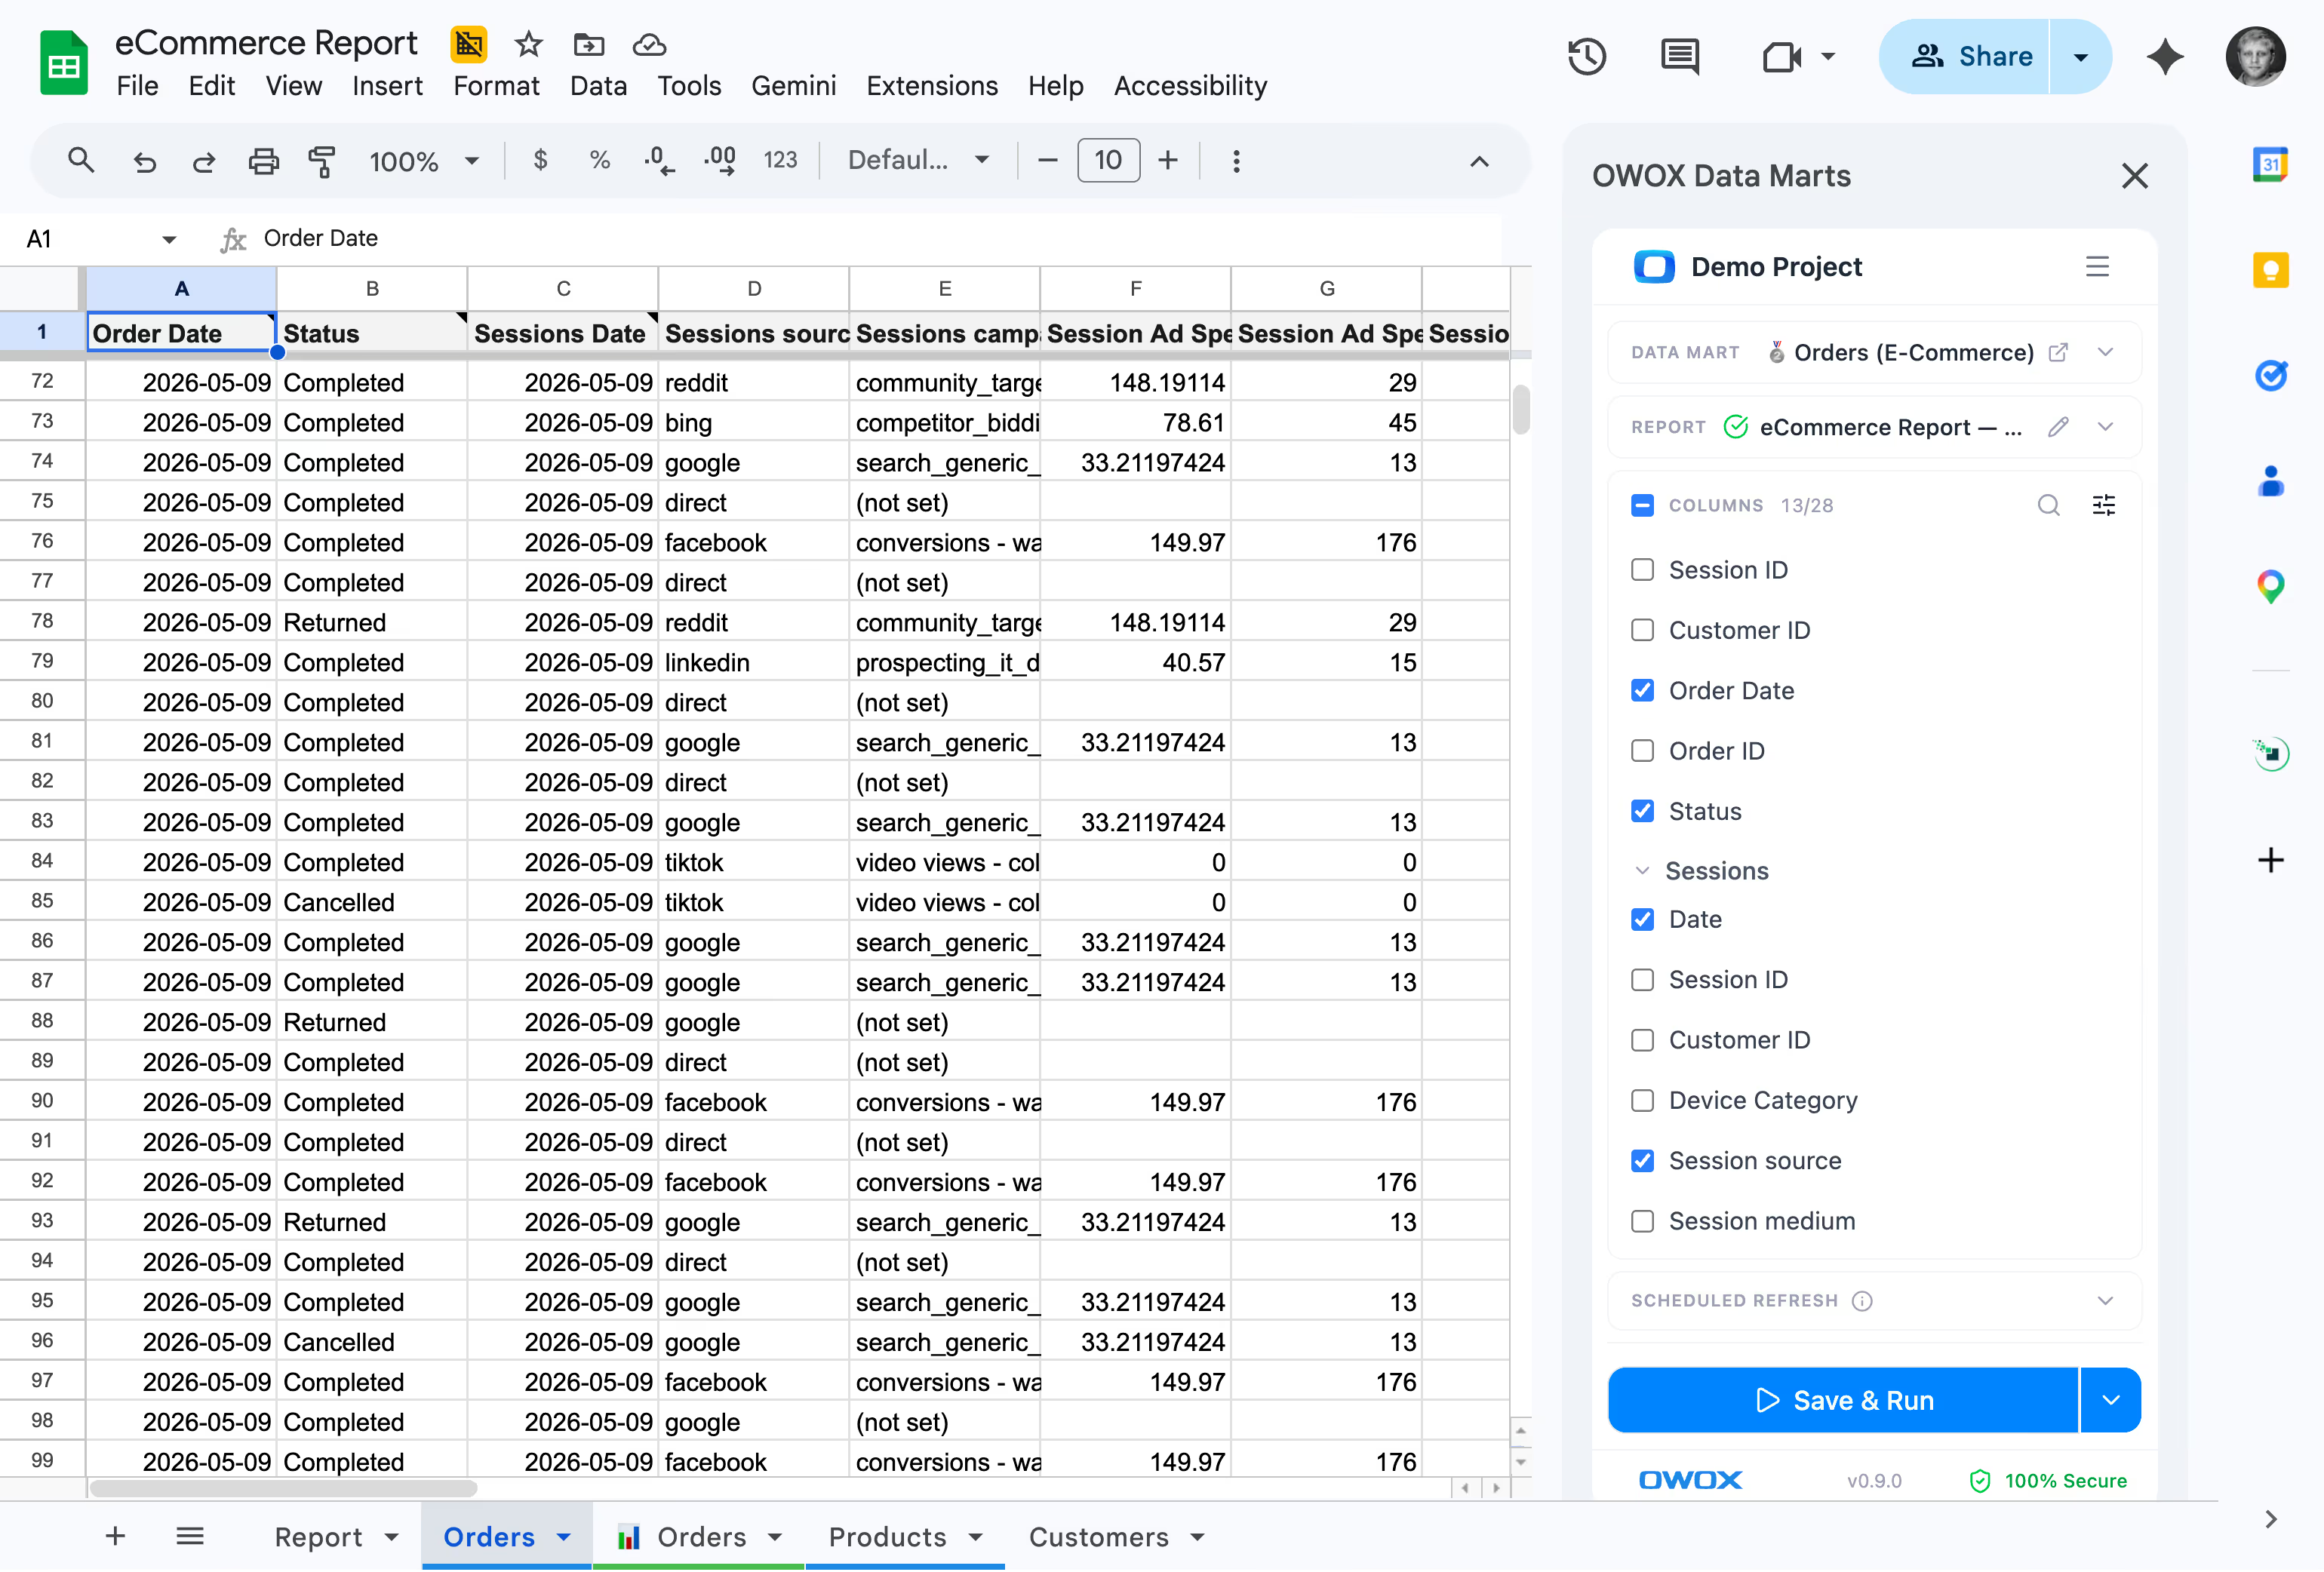
The OWOX sidebar puts the pipeline library inside Google Sheets. Your sales managers browse, join, filter by region, and refresh. No RevOps in the loop.
- Column picker shows "Deal Value," "Stage," "Days in Pipeline," "Marketing Source" — business-friendly names
- Joins follow analyst-defined keys — combine pipeline with attribution or revenue without SQL
- Every cell is deterministic — same number for sales, marketing, and finance. Patented technology.
F06 · Pipeline intelligence
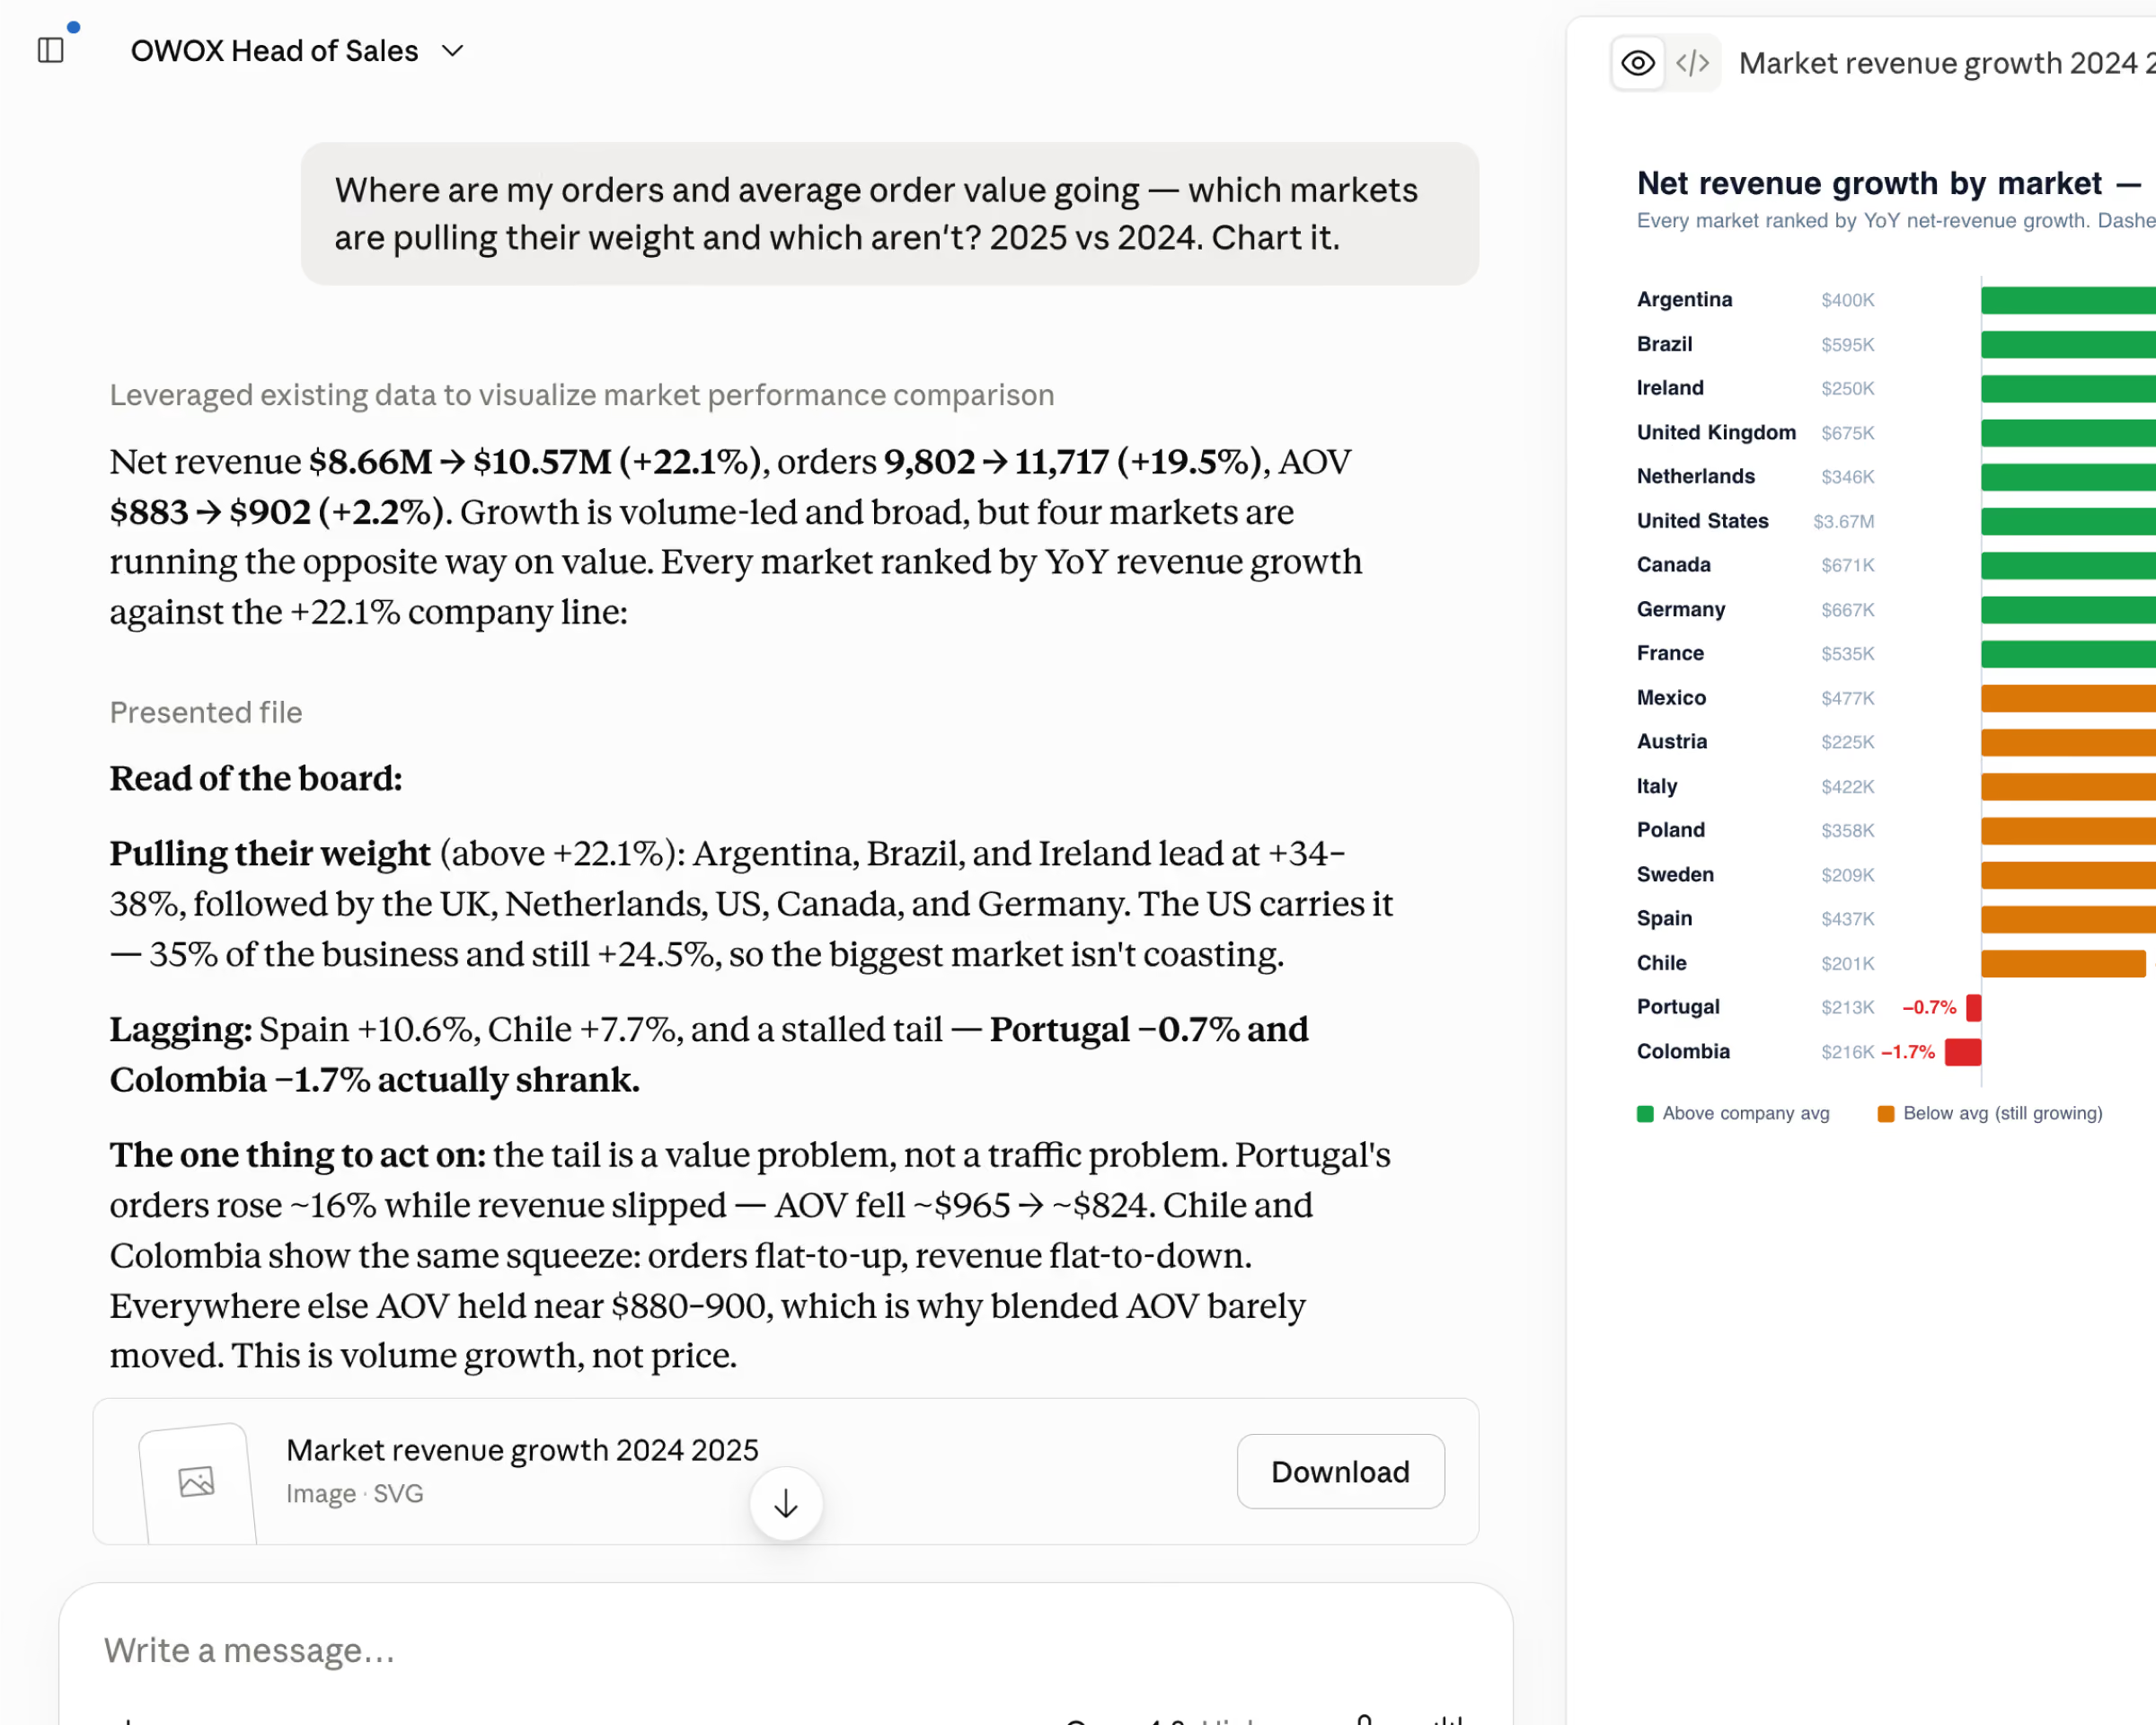
Weekly, trusted pipeline brief right in your AI Tool
Forecast confidence. Zero hallucinations.
- Pipeline health — stage conversion, velocity trends, slippage alerts — auto-generated weekly
- Forecast confidence scored from governed data, not gut feel
- Patented technology — AI narrates pipeline trends, never invents the numbers
F07 · OWOX MCP
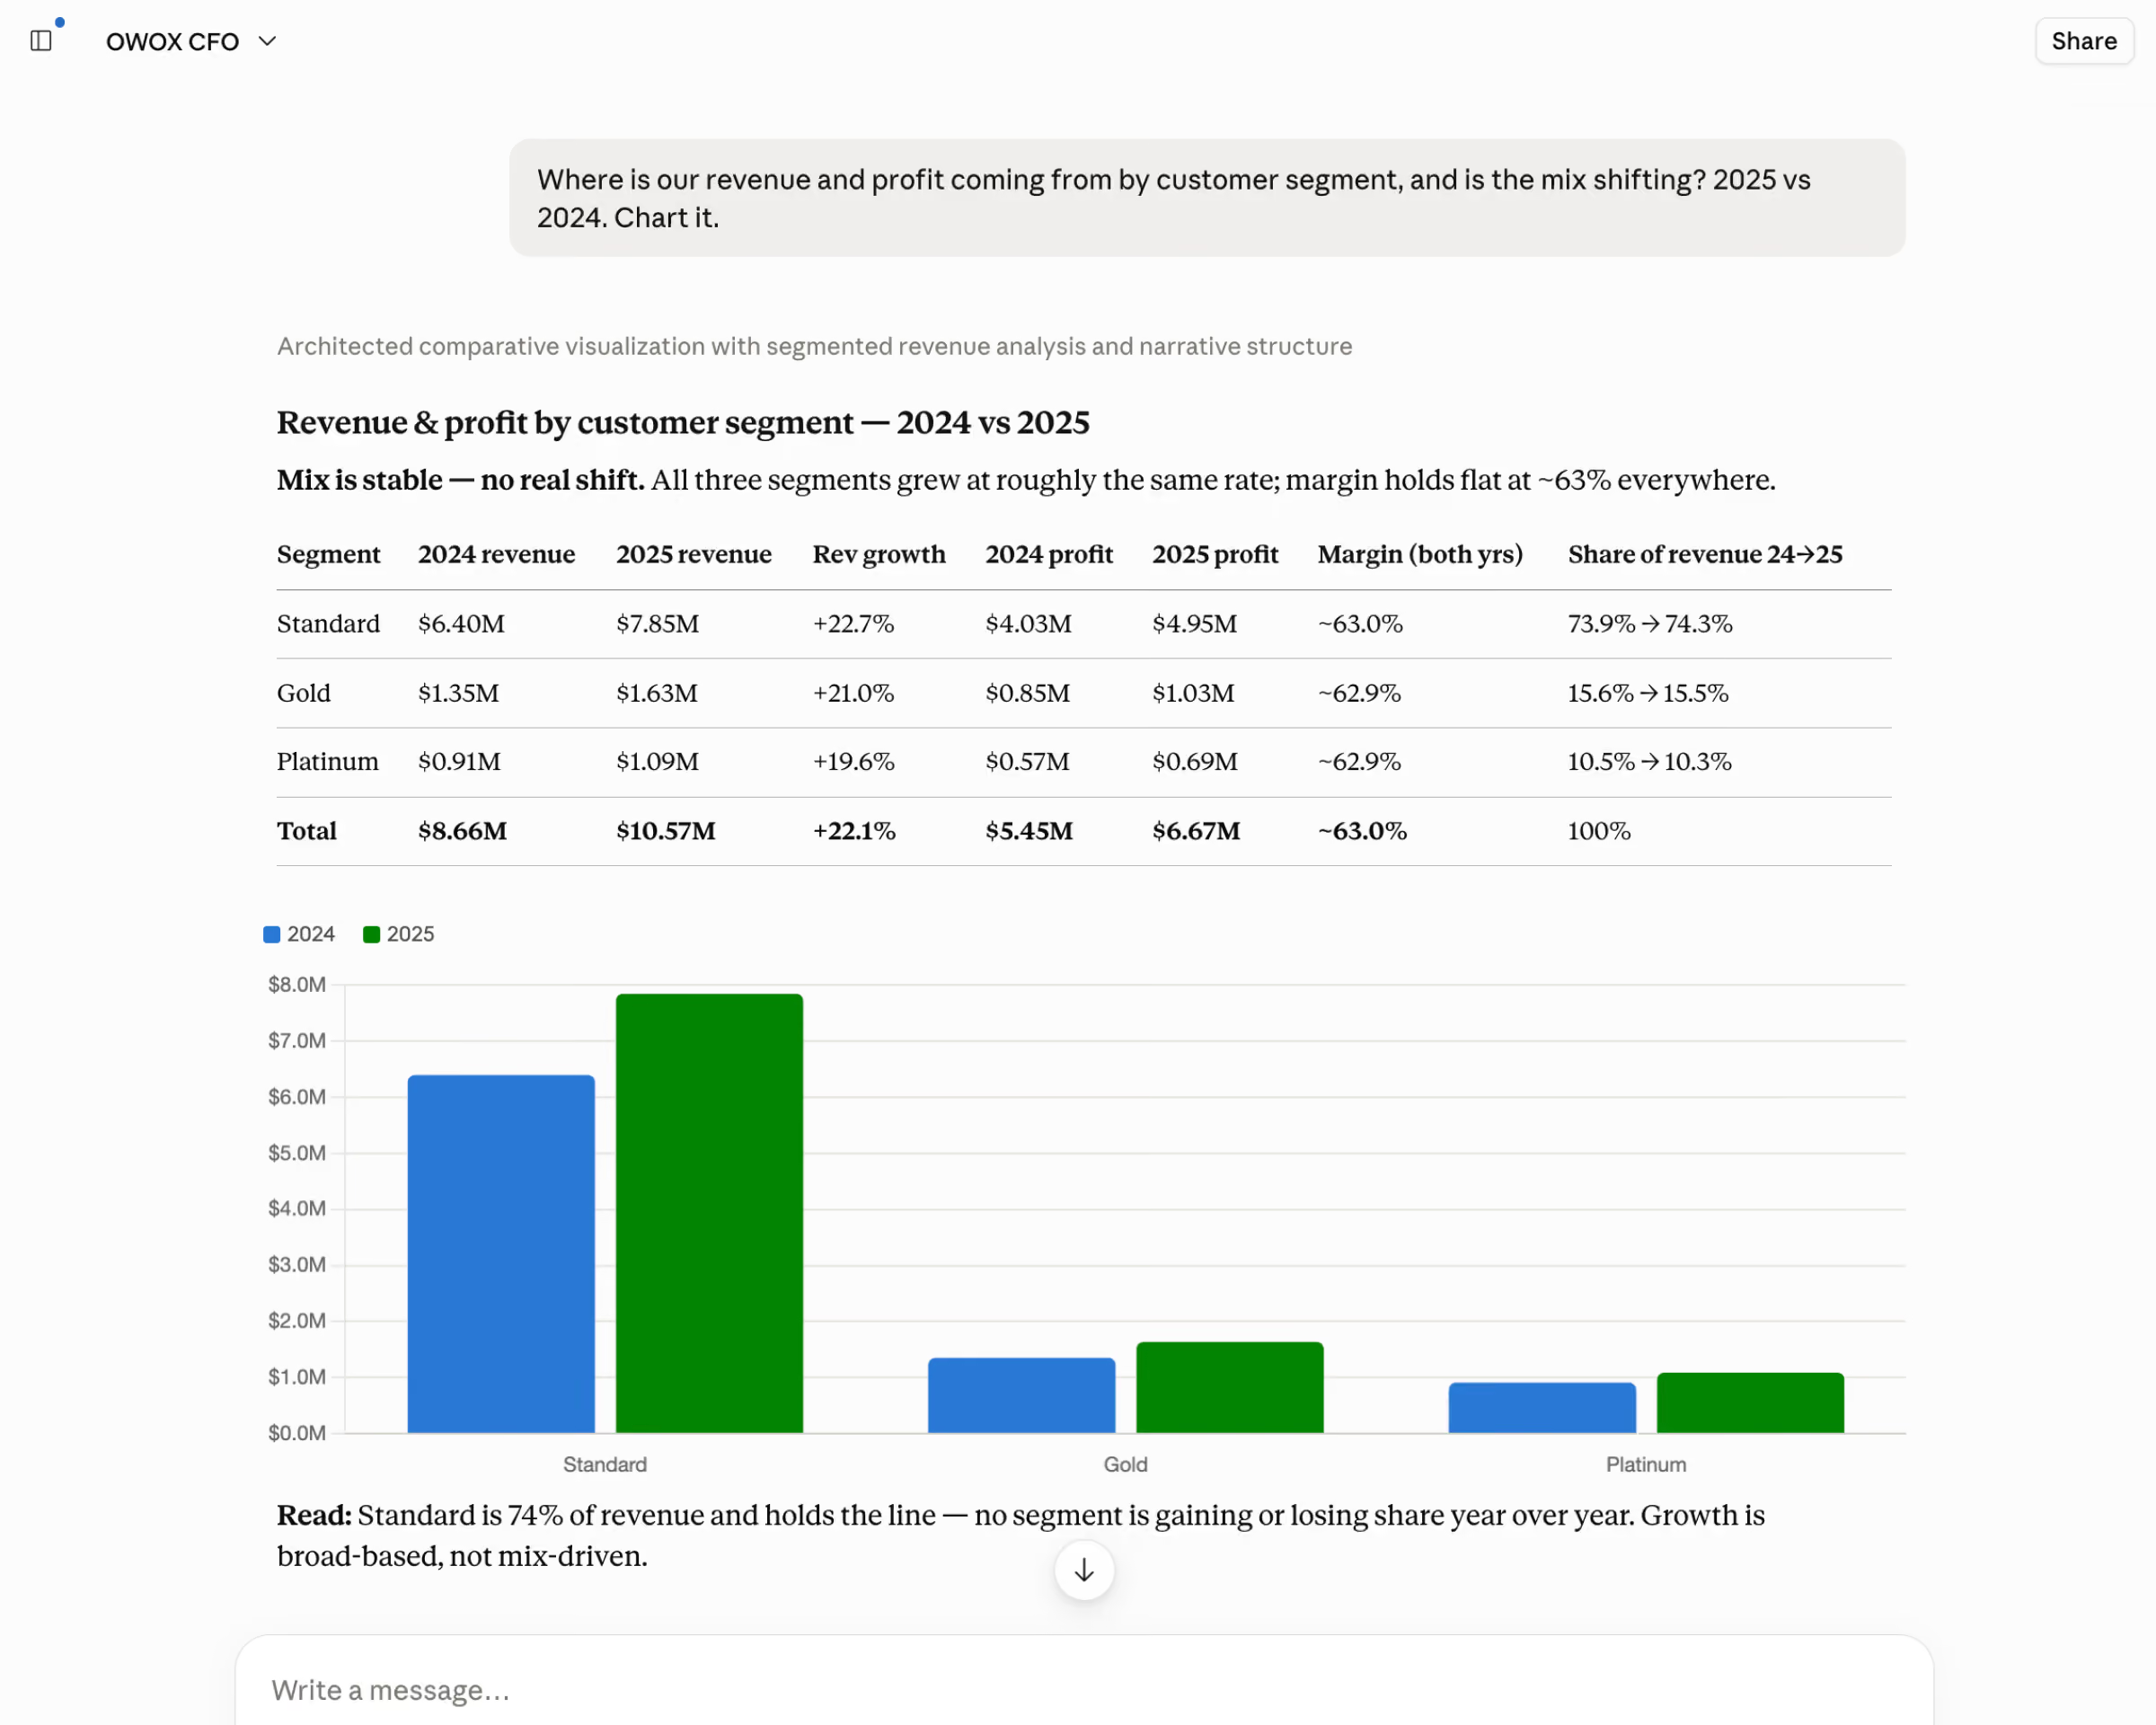
Ask your pipeline a question. In your own AI chat.
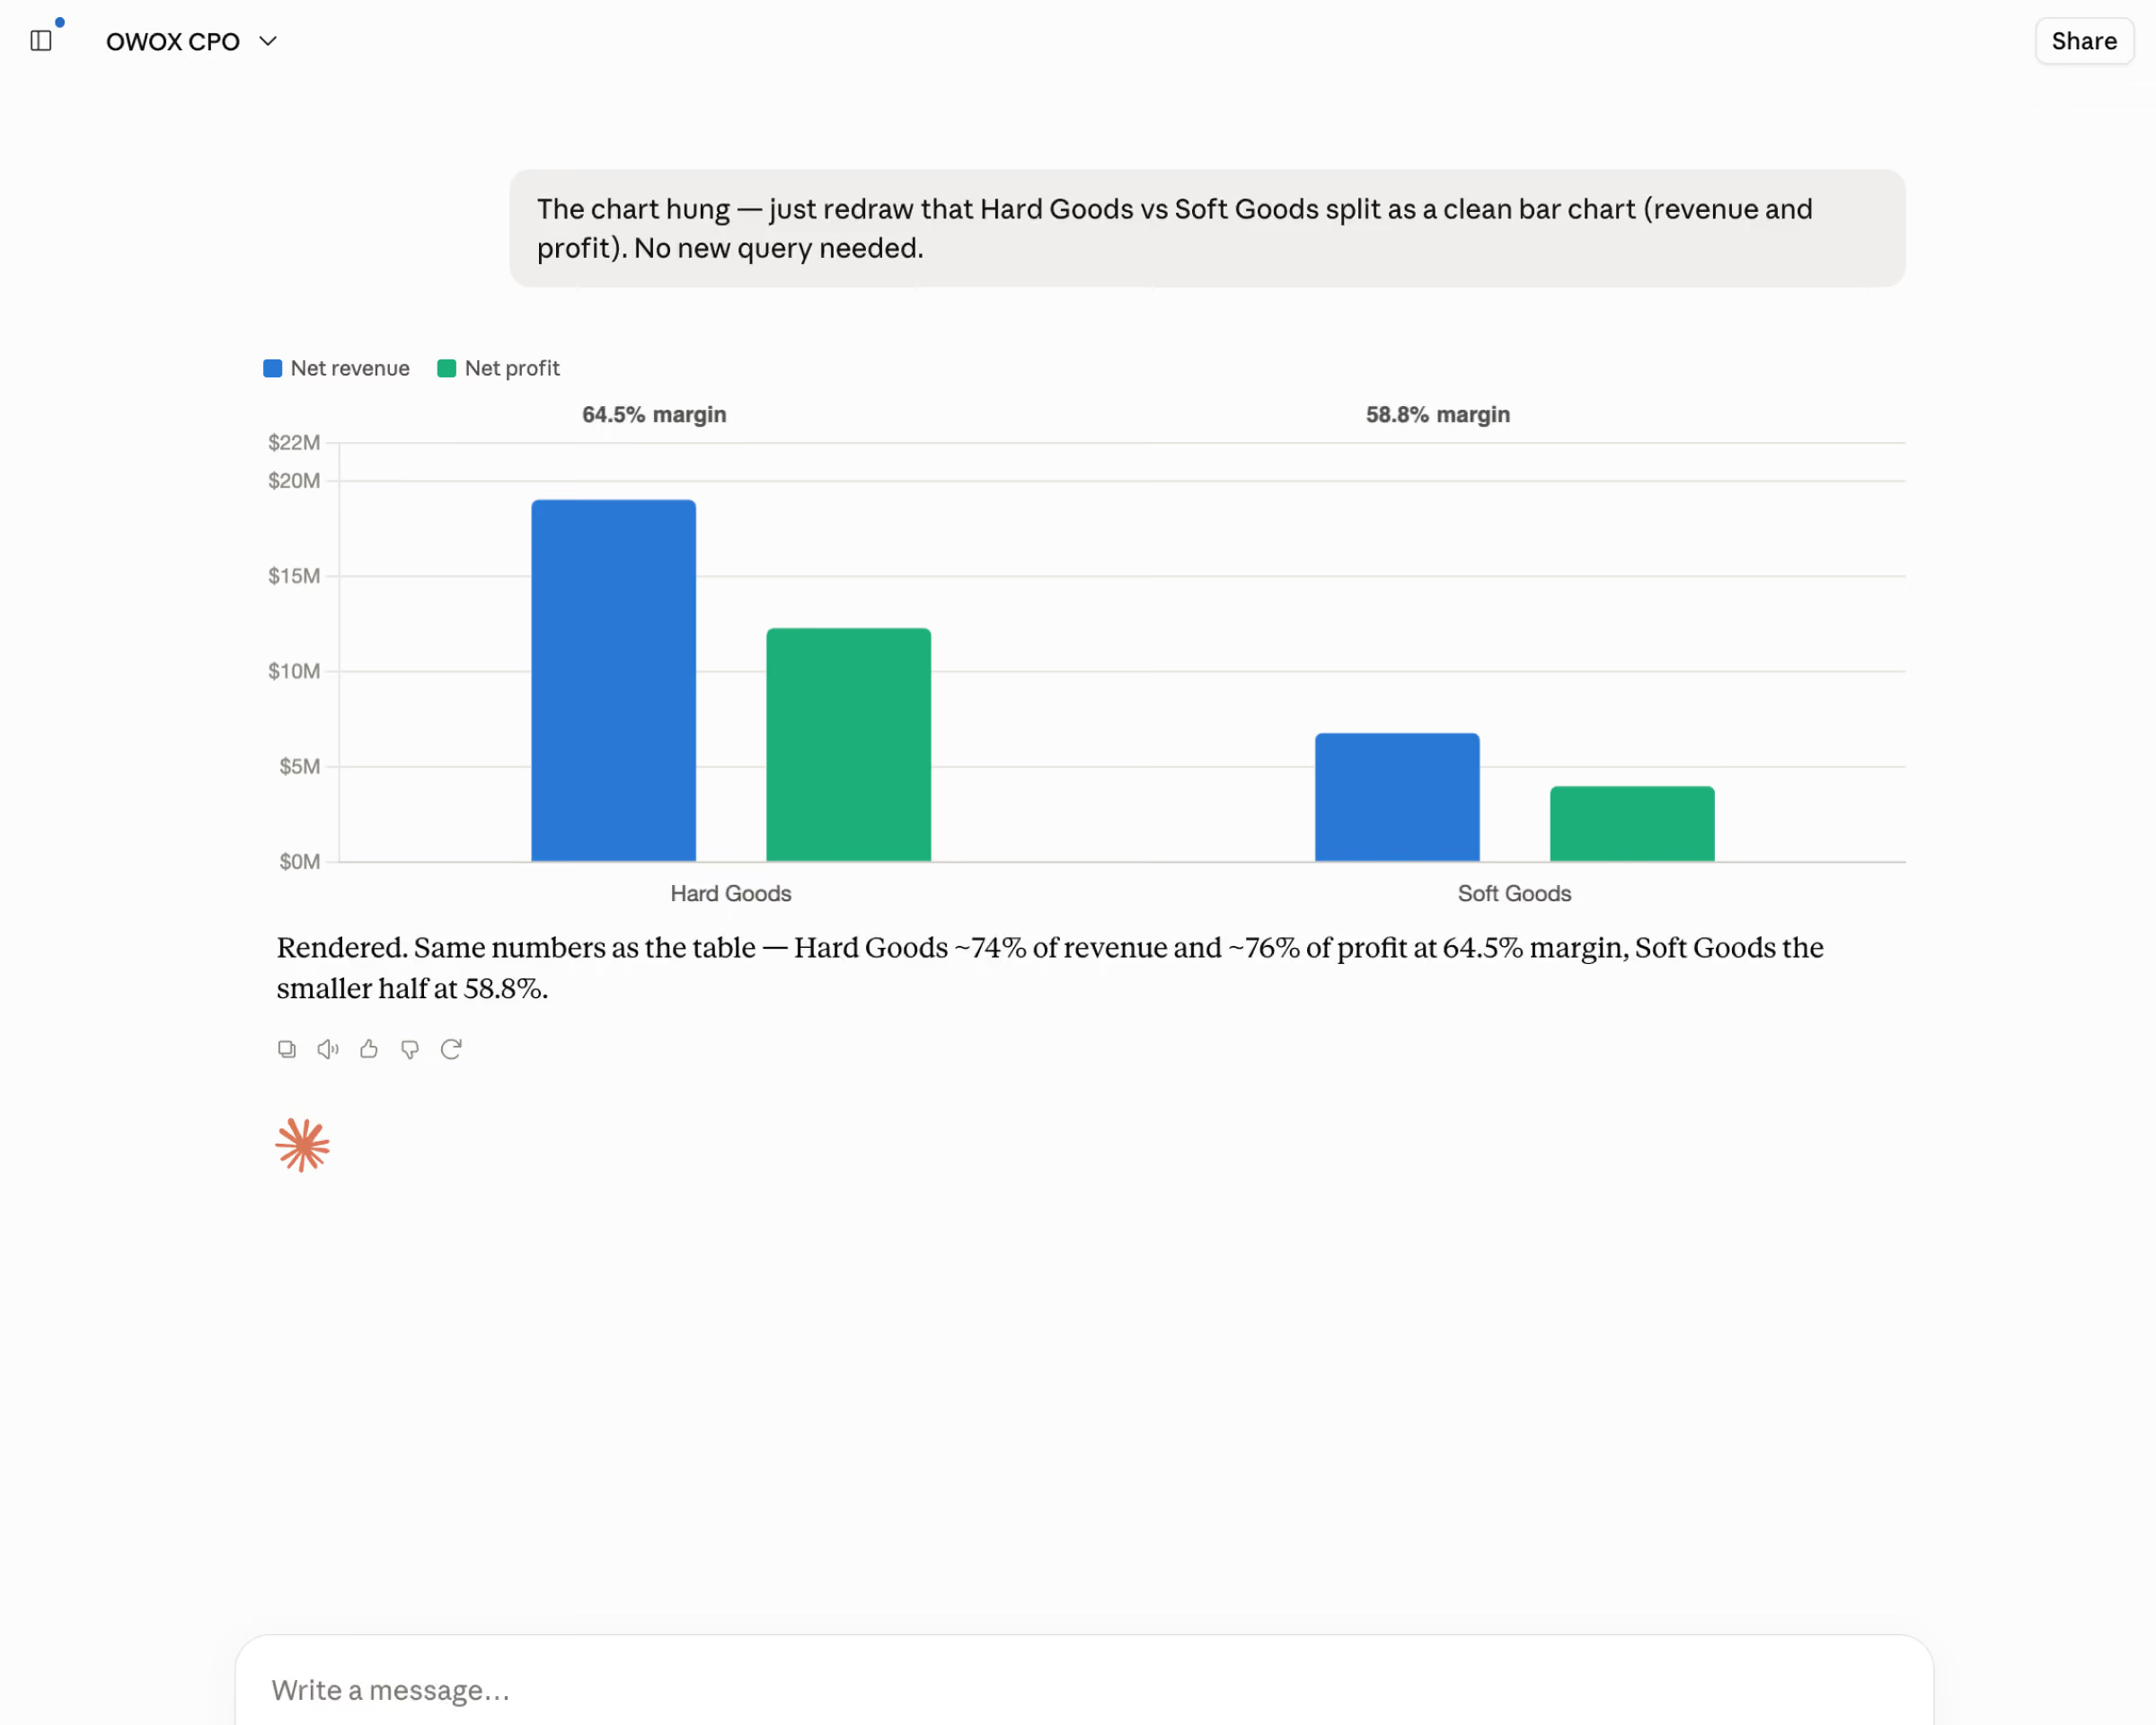
Ask in Claude or ChatGPT: "weighted pipeline by stage and rep vs last quarter?" You get a forecast-grade number with the trail attached — computed by analyst-approved SQL over your governed CRM+revenue joins, never guessed by the model. This is MCP.
- One reconciled pipeline number — CRM + marketing + revenue joined — answerable on demand, mid-deal, mid-forecast-call.
- Zero hallucinations, made explicit: the model narrates, analyst-approved SQL computes. It can't invent a join or a stage. Patented.
- No semantic-layer tax: your RevOps analyst publishes a mart and defines the join keys — weeks, not a multi-quarter modeling project.
What changes
Zero hallucinations

Zero hallucinations
AI narrates, analyst-approved SQL computes every number. Patented. Not a chatbot guessing your forecast.

No semantic-layer tax
No 6-month modeling project. Your analyst publishes a mart, defines the join keys, done — live in weeks.
How it works
From pipeline chaos to governed forecast — in three steps
Your RevOps team builds the library. Your sales org self-serves. AI delivers pipeline intelligence. The reconciliation meetings end.
Step 1
RevOps joins the data
CRM, marketing, and revenue data joined and published as governed Data Marts. One definition per metric.
Step 2
Sales team self-serves
Sales managers open Sheets, browse the pipeline library, filter by rep or region, refresh. No RevOps bottleneck.
Step 3
AI delivers the weekly brief
Pipeline narrative — conversion rates, velocity, forecast confidence — to Claude or ChatGPT every Monday. Deterministic.
What changes for your sales org
Answer "are we going to hit the number?" with data, not gut
When pipeline, attribution, and revenue pull from the same governed source, the sales org transforms.

Marketing and sales finally agree
MQL-to-close tracing in one view. Marketing sees which leads converted. Sales sees which efforts mattered. No more "your MQLs were junk" arguments.

Forecast you can defend
Pipeline data is governed, versioned, deterministic. Your forecast has a foundation, not a formula you inherited.

RevOps works on operations, not exports
When the sales team self-serves pipeline data, your RevOps lead stops spending 20 hours/week on snapshots and starts optimizing the process.
What users are saying
What sales leaders say
Real things real customers said — each quote pinned to a specific claim, straight from the quotes database.
 Nodari RizunFounder & CEO, Pürblack®
“We regained time. And time is the one resource that never comes back.”
 Mark SimmonsCMO, Pürblack®
“As a marketing leader, it's so refreshing to make decisions based on data and insights rather than guesses.”
Nodari RizunFounder & CEO, Pürblack®“We don't need to wait for a report anymore. We don't wait on an engineer or an account manager — within minutes we get data, make a decision, question it, and pivot.”
Customer stories
Sales orgs that unified their pipeline data
Teams that ended the pipeline reconciliation problem
 "For 10 years I was blind." The day Pürblack® founder stopped guessingSecondsto get reports across six channelsRead the story
  How OWOX Reports Helped Reformation Make Data-Backed DecisionsMinutesfrom data request to business decisionRead the story
  How OWOX Reports Streamlined Operations for WorkSimpli, Saving Over 10 Hours Weekly10hrs+saved per week on manual reportingRead the story
 WHO BUILDS YOUR PIPELINE LIBRARY
One governed pipeline — built by the analyst your RevOps team hires
Your RevOps team sets up a Reporting Analyst once: CRM, marketing, and revenue data joined into a governed library your sales org self-serves. When someone needs to ask "why did win-rate drop in EMEA?" in plain language, the Senior Analyst answers — traceable to SQL, never hallucinated.

Reporting Data Analyst · From $65/mo
Builds your governed pipeline library — CRM joined with marketing and revenue, self-served in Sheets.

Senior Data Analyst · From $90/mo
Answers "why did win-rate drop in EMEA?" in plain language — @owox in Claude or ChatGPT. Traceable to SQL.
FAQ
Questions sales leaders ask
Can OWOX pull data from our CRM?
OWOX connects to the data warehouse where your CRM data lives — not to the CRM directly. Most sales orgs already replicate Salesforce, HubSpot, or Pipedrive data to a warehouse via Fivetran, Stitch, Airbyte, or native CRM exports. OWOX sits on top of that: your RevOps team wraps the CRM tables as Data Marts, joins them with marketing attribution and revenue data, and publishes the governed library. If your CRM data isn’t in a warehouse yet, that’s a one-time setup — tools like Fivetran handle it in an afternoon. Once the data is there, OWOX makes it joinable, governed, and self-serve for your entire sales org.
How does OWOX solve the marketing-sales attribution argument?
The argument exists because marketing and sales look at attribution from different systems. Marketing sees platform-reported conversions. Sales sees CRM close data. Neither is wrong — they just see different slices. OWOX joins both datasets in the warehouse: ad platform touchpoints + CRM pipeline stages + actual revenue from your billing system. Your analyst defines the attribution logic as a Data Mart. When marketing pulls "Deals Influenced by Campaign X" and sales pulls "Pipeline by Source," they’re pulling from the same joined data with the same definitions. The argument ends because the data is the same.
Can my sales team really use this without training?
The Google Sheets Extension is a column picker. Your regional sales manager opens a Sheet, browses the Data Mart library (they see names like "Pipeline by Stage" and "Revenue by Rep"), checks the columns they want — Deal Value, Stage, Close Date, Marketing Source — filters by their region, and hits refresh. It’s closer to a Sheets filter than a BI tool. Nothing to install, nothing to configure, no query language to learn. The technical work happens once on the RevOps side.
How reliable is the AI forecast brief?
The AI brief doesn’t generate a forecast from scratch — that would be dangerous. Instead, your analyst defines the forecast logic as a Data Mart: pipeline by stage, historical conversion rates, deal velocity metrics. Insights runs that deterministic SQL against your warehouse and computes the exact numbers. AI then writes the narrative: "Q3 pipeline is $4.2M at a 68% stage-weighted conversion rate, implying $2.8M in expected closed revenue — down 8% vs. Q2 at the same point." The $4.2M, 68%, and $2.8M are SQL results. Every number is traceable. Patented technology.
What does this cost?
Cloud Starter is $30/month — includes Data Mart management and the Google Sheets Extension. Your RevOps lead can have the first pipeline Data Marts live in a day. Team plans from $875/month add AI Insights (the weekly pipeline brief), multi-destination delivery (Slack, Teams, email), and SLA. For context: your RevOps lead currently spends 20+ hours/week on pipeline data pulls and reconciliation. At $60/hour, that’s $4,800/month in RevOps time spent on data extraction, not process optimization. OWOX eliminates most of that.
We already have CRM dashboards. Why do we need this?
CRM dashboards show CRM data. They can’t join it with marketing attribution, advertising spend, or revenue from your billing system — because that data lives in different tools. Every time a sales leader asks "which marketing campaigns actually drove pipeline?", someone has to manually export, join, and reconcile data from 3+ systems. OWOX automates that join in the warehouse. Your CRM data + marketing attribution + revenue = one governed library. CRM dashboards stay for day-to-day pipeline management. OWOX adds cross-system visibility that CRM alone can’t provide.