
Solution
NewThe OWOX MCP is live — ask in Claude & ChatGPT →
Your team files more data tickets than anyone. Let’s fix that.
OWOX gives your marketing team direct access to governed campaign data — attribution, spend vs. revenue, cross-channel performance —right from Claude or ChatGPT. One-click in Google Sheets. No analyst queue. No CSV exports. No conflicting numbers.
170,000 users can't be wrong
Marketplace users
175K+
teams running OWOX from the Google Workspace Marketplace
G2 rating
4.9
296 verified reviews on G2
Connector downloads
156K+
open-source connector installs via npm
GitHub stars
231
the platform is open source — star it, fork it, self-host it
You need the data
Your team files more data tickets than anyone.
Every campaign launch generates a wave of data requests. Every board review needs fresh metrics. Your analysts are drowning in marketing tickets — and your team is still waiting.
How your team gets data today
File a ticket. Wait. Hope it’s right.
- Campaign performance request filed Monday. Data arrives Thursday. Wrong date range.
- Attribution is whatever the last-click platform claims — nobody verifies
- CSV exports from 5 platforms stitched together every week — different schemas
- Marketing says $2.1M revenue. Finance says $1.8M. Board meeting goes sideways.
- Your analyst spends 60% of their time on marketing requests — and resents it
With OWOX
Your team self-serves. The numbers reconcile.
- Campaign performance, attribution, spend vs. revenue — in a joinable library in Sheets
- Pick columns, filter by campaign or channel, refresh on schedule — no tickets
- Marketing and finance pull from the same Data Marts — same numbers, always
- Ask your marketing performance a question in Claude/ChatGPT.
- Your analyst works on attribution models, not CSV exports
Your marketing team shouldn’t need a ticket to see ROAS. And your analyst shouldn’t spend their career pulling it.
F04 · The marketing library
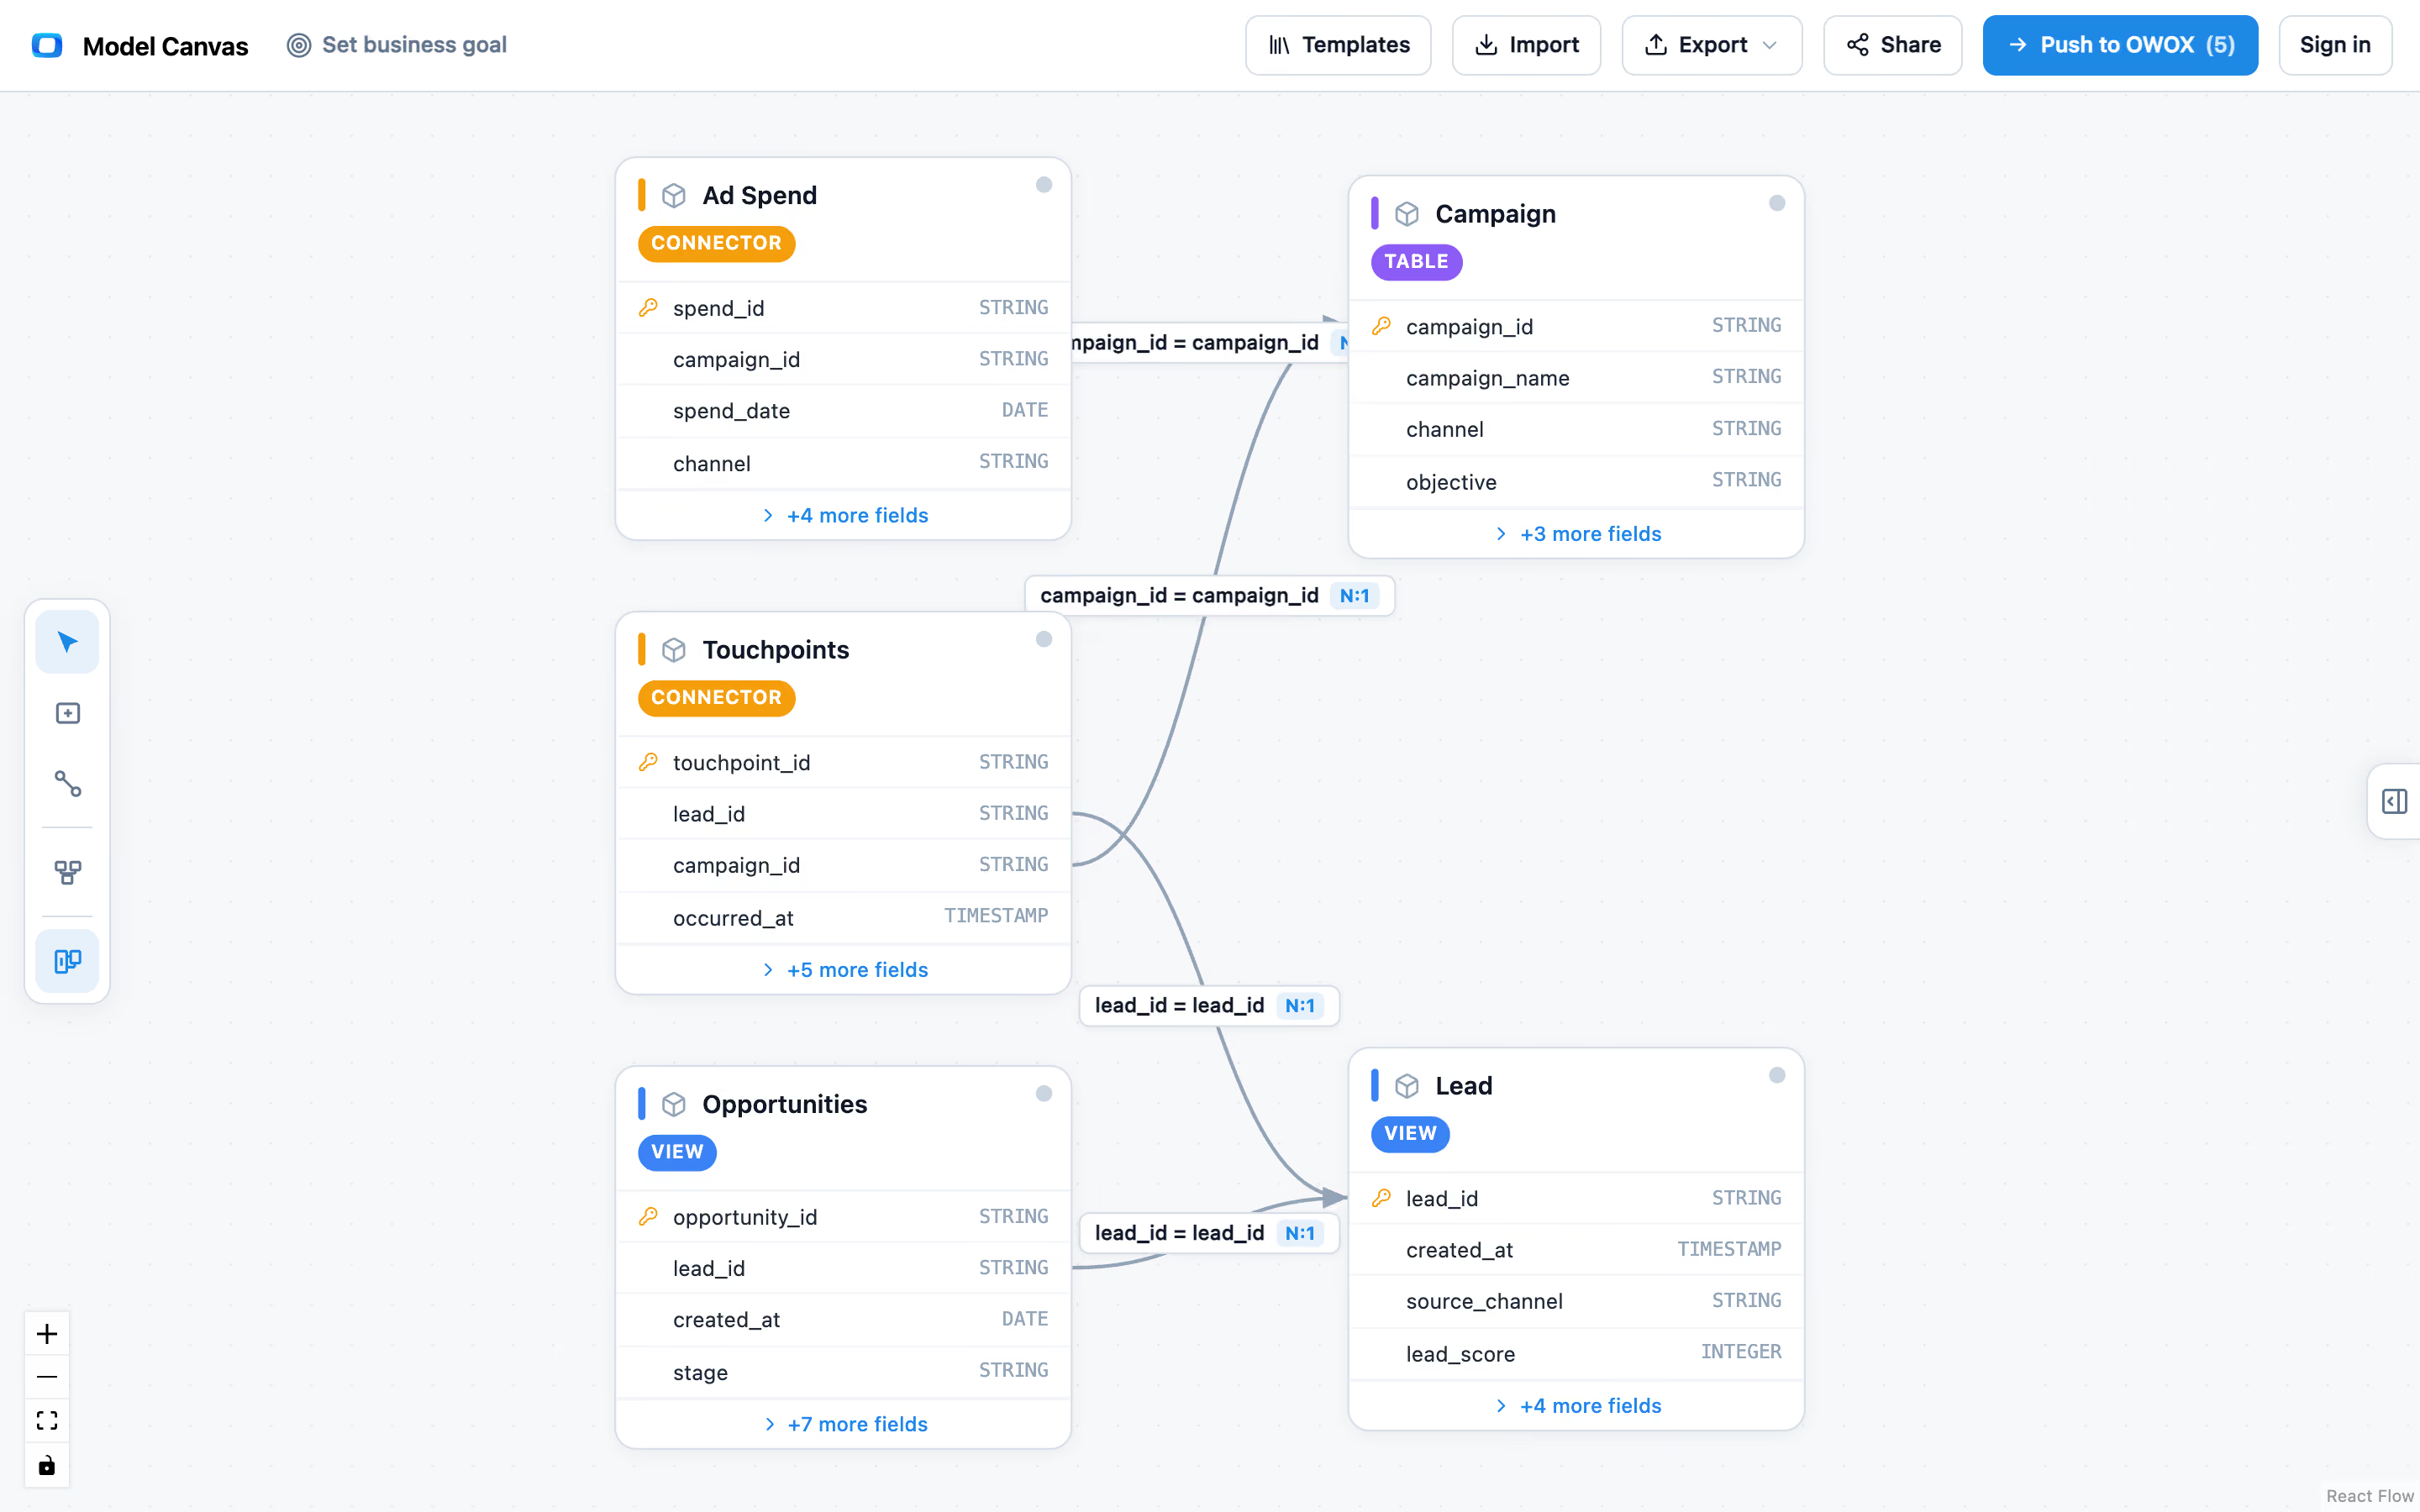
Campaign data from every platform. Governed.
Your data team joins ad platform data with revenue and CRM data, publishes it as a governed library. Your marketing team sees business-friendly names, not raw tables.
- Ad spend from Facebook, TikTok, LinkedIn, Google — joined with actual revenue in one Data Mart
- Aliases, descriptions, and ownership on every metric — your team knows what each number means
- One definition of "revenue" across marketing, finance, and leadership — no more reconciliation
F05 · SELF-SERVICE
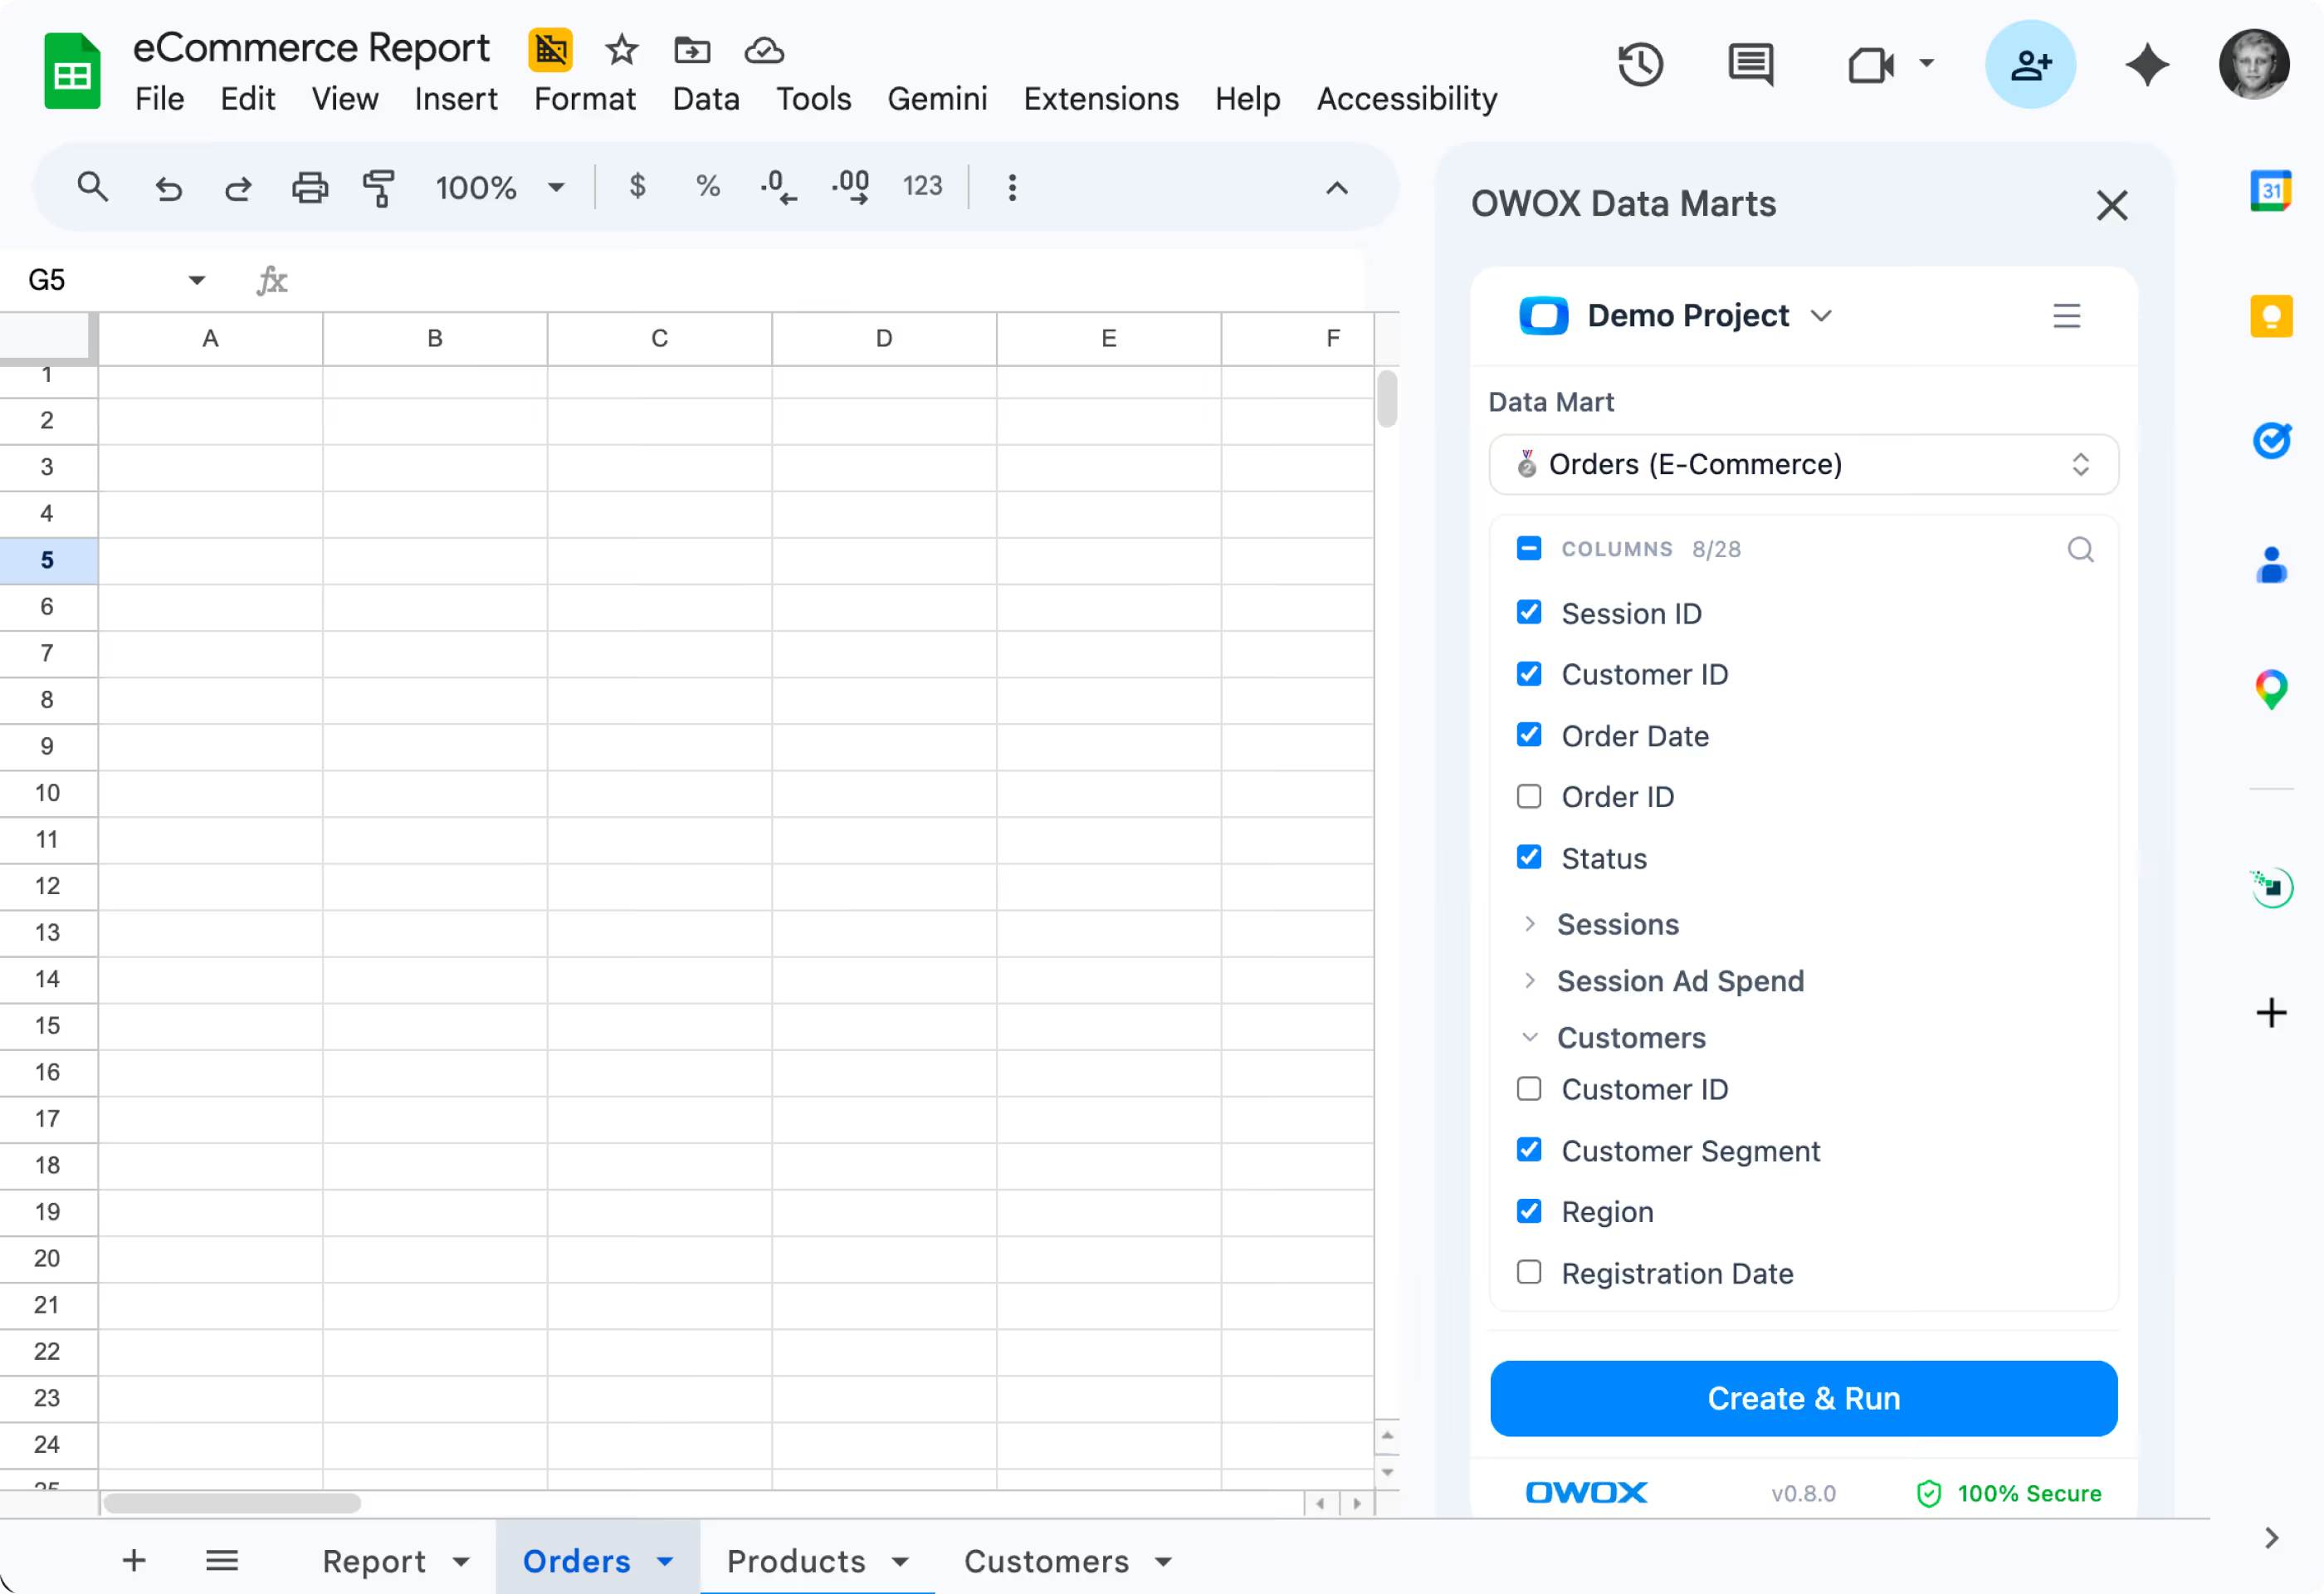
Your team self-serves. Here’s what that looks like for them.
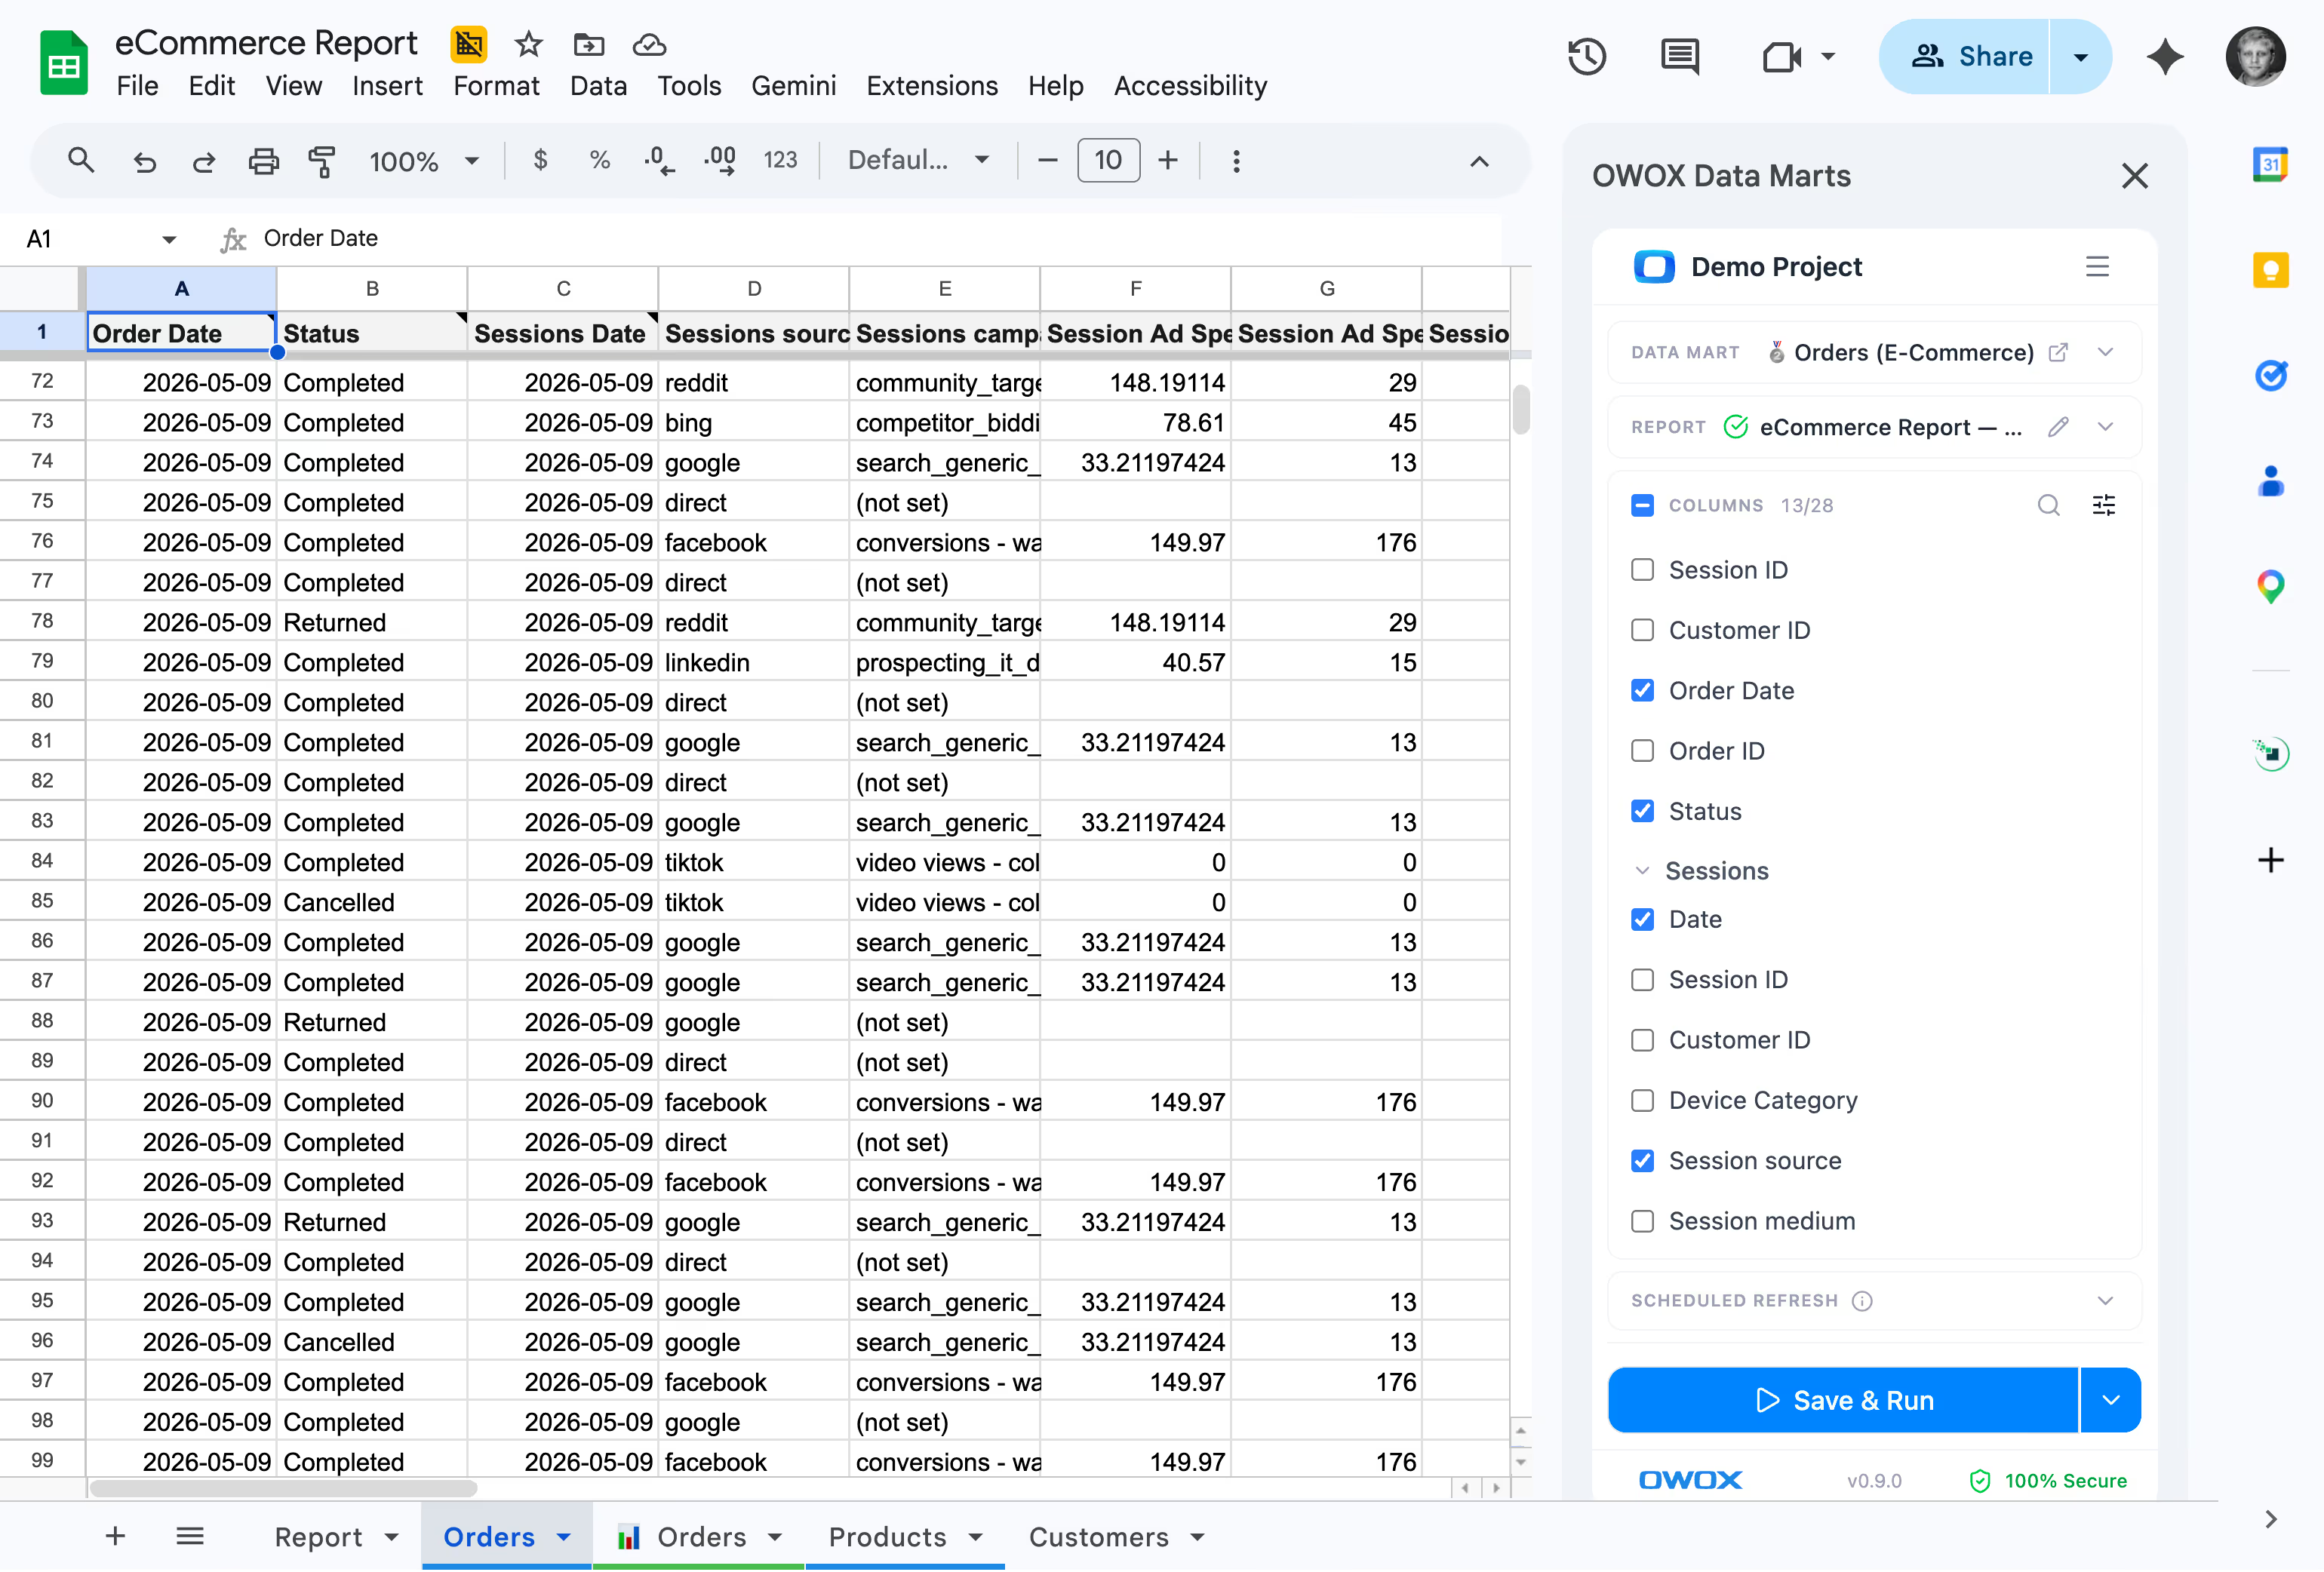
Campaign managers browse the library in Google Sheets, pick business-friendly columns, and refresh on schedule — no SQL, no tickets, no hallucinations.
- Column picker shows “Cost per Acquisition,” “ROAS by Platform,” “Revenue by Campaign”
- Joins follow analyst-defined keys — cross-platform reports without SQL
- Every cell is deterministic, traceable — patented technology
F06 · Your weekly brief
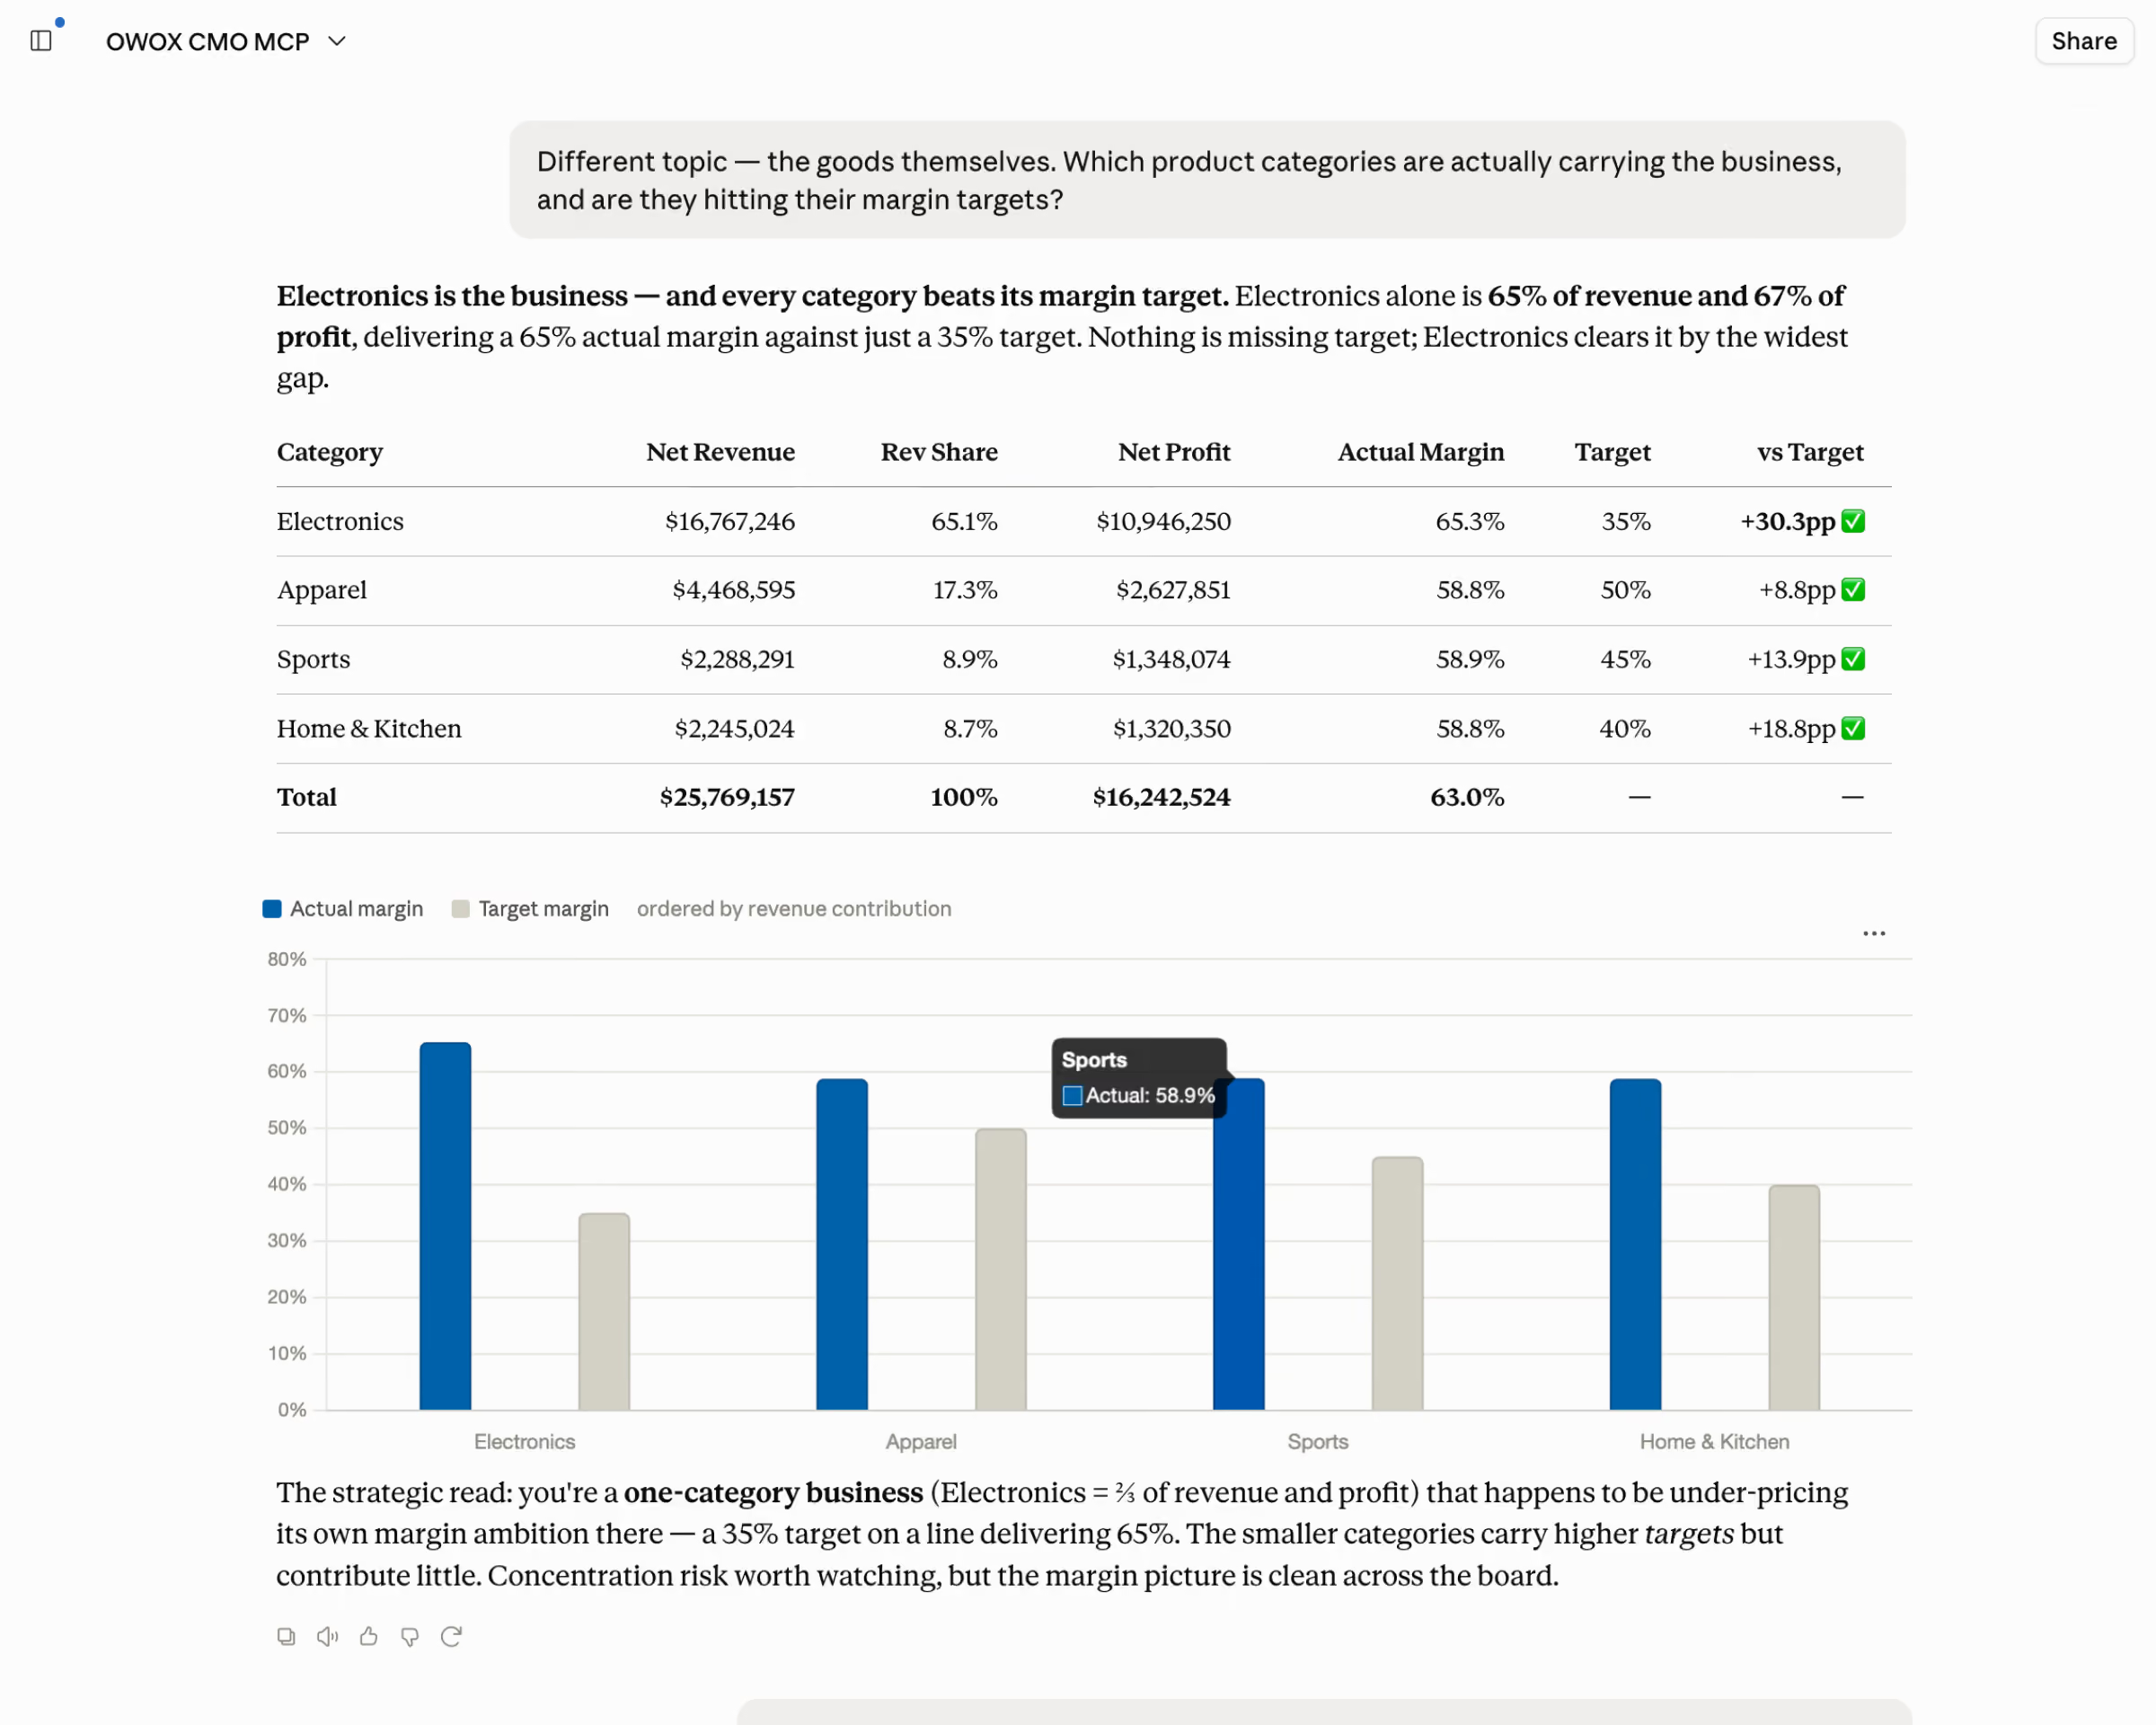
AI marketing brief — pushed to your chat every morning. Or pull any answer on demand via MCP.
OWOX turn your marketing data into recurring performance narratives
- Get performance summary with spend, ROAS, CPA, and revenue trends
- Anomaly detection — "TikTok CPA spiked 40% vs. last week" highlighted automatically
- Patented technology — AI narrates trends, never invents the numbers
F07 · OWOX MCP
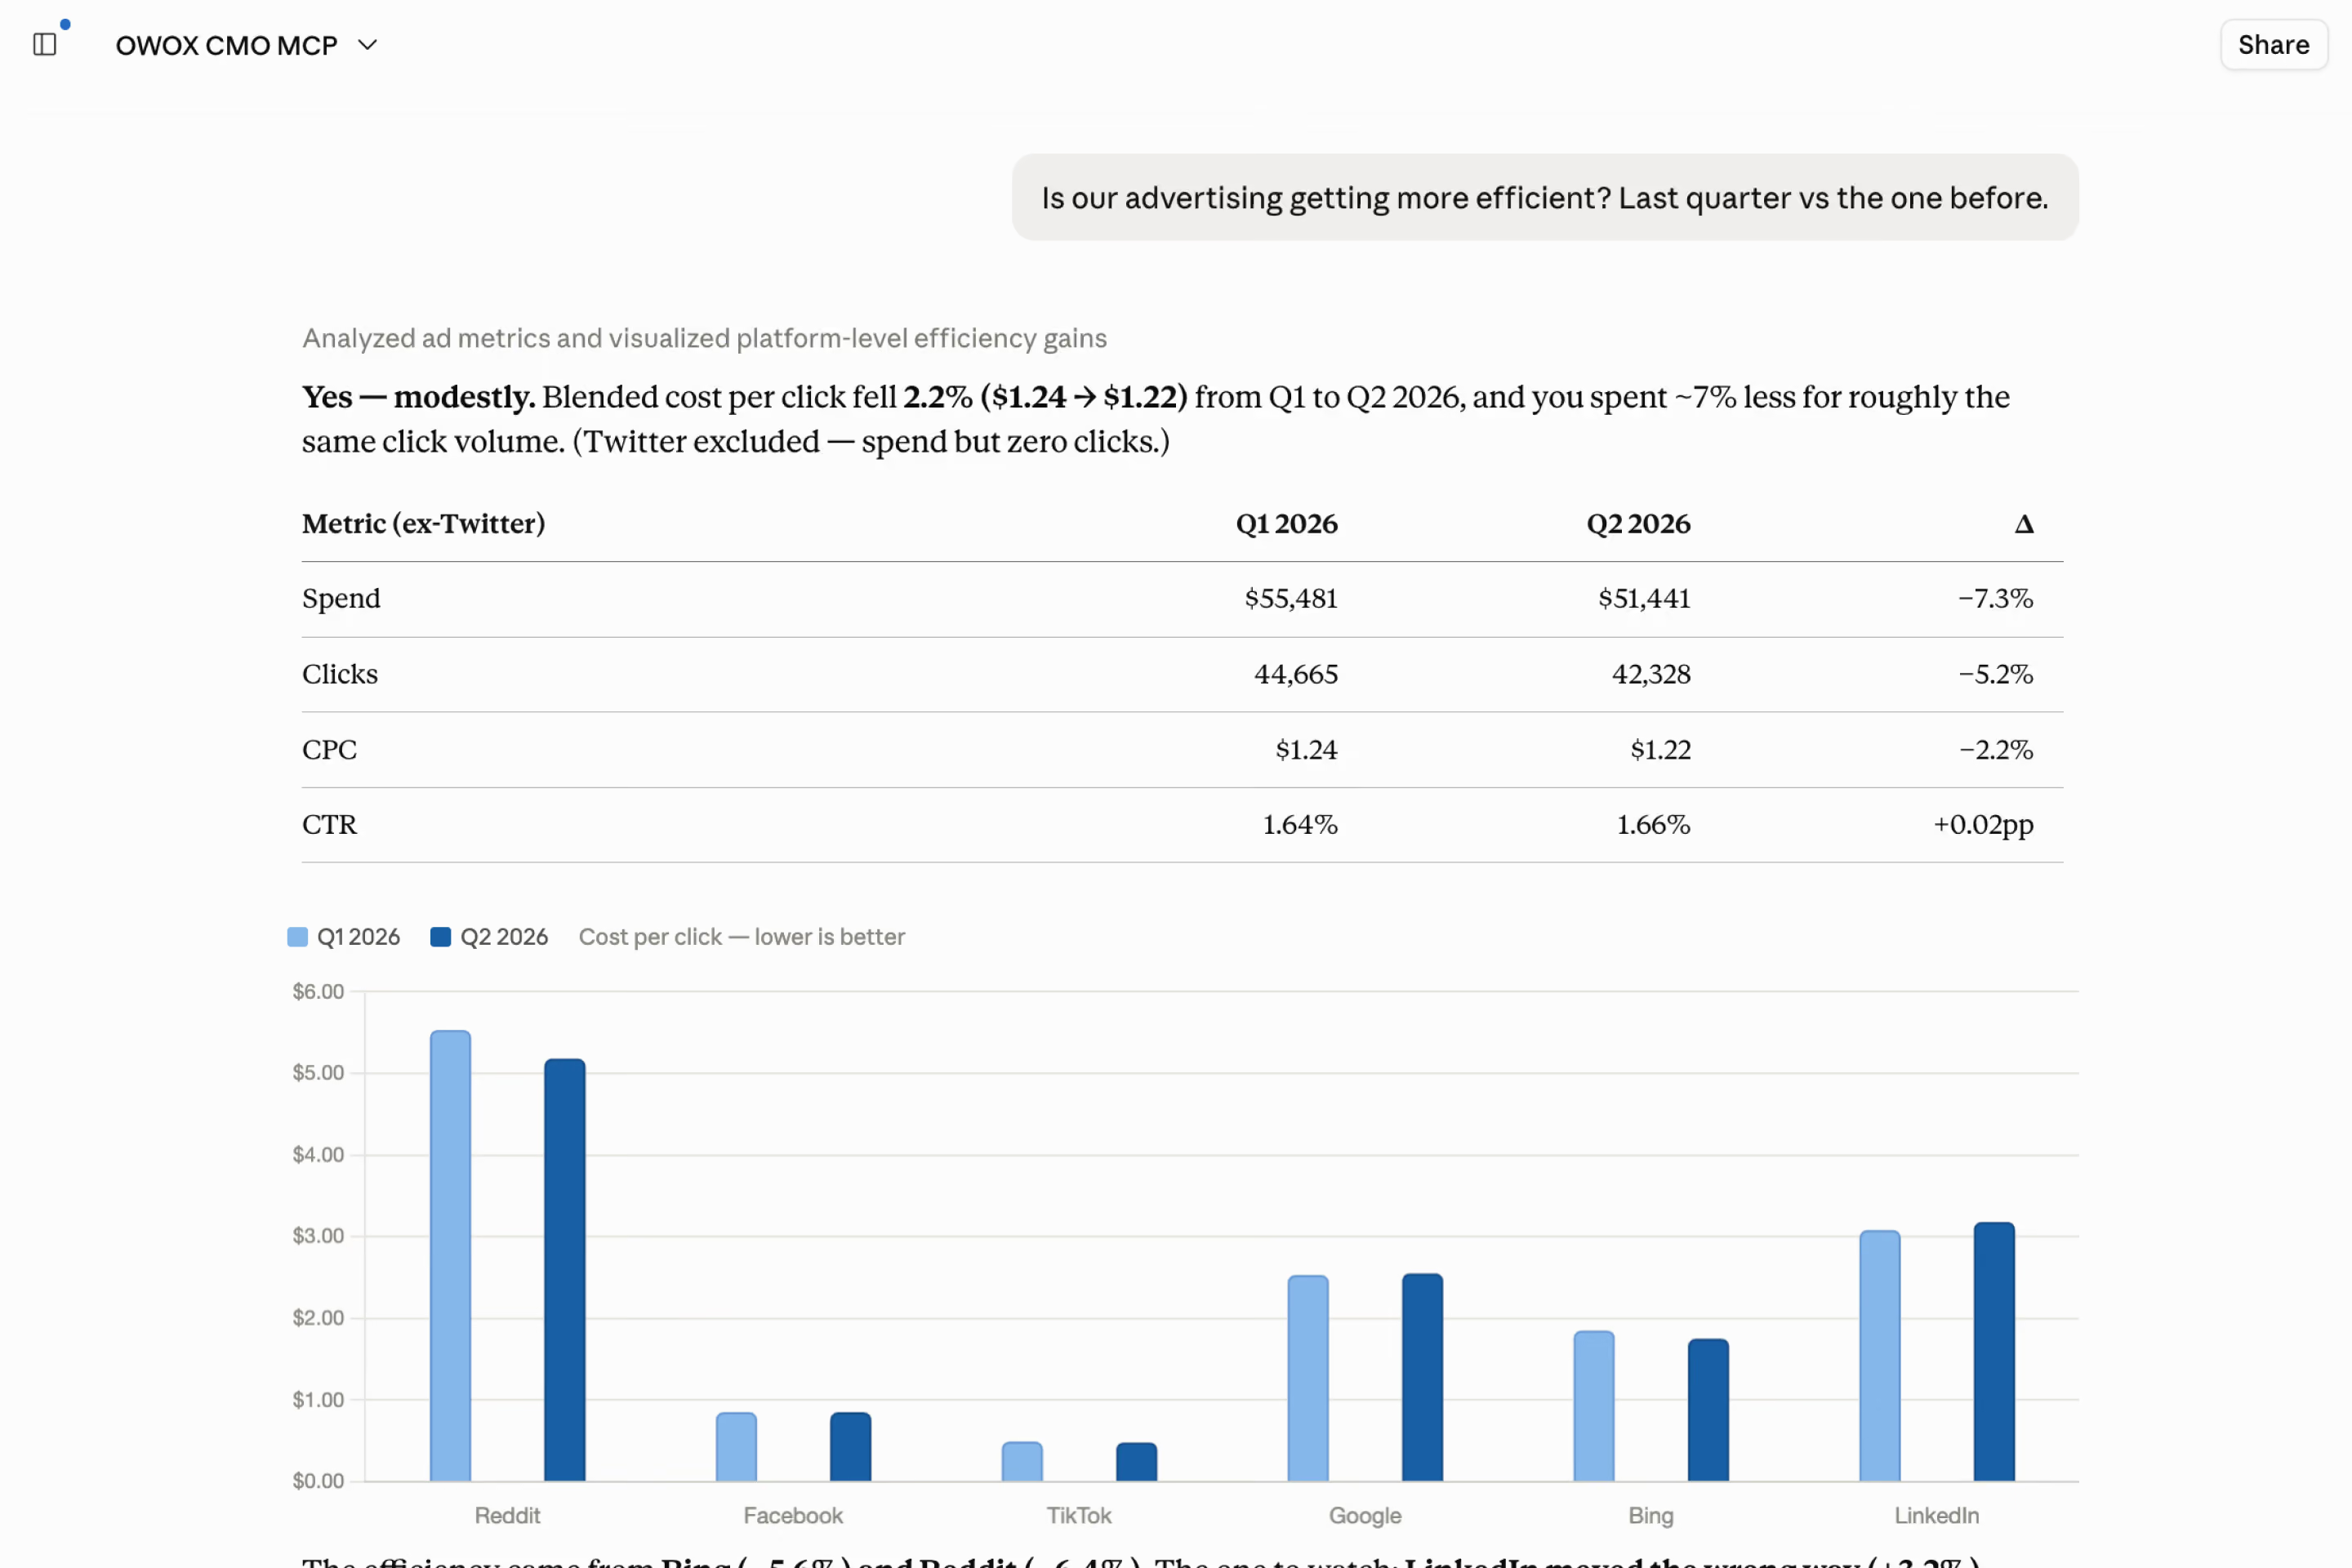
Ask your team's performance a question. In your own AI chat.
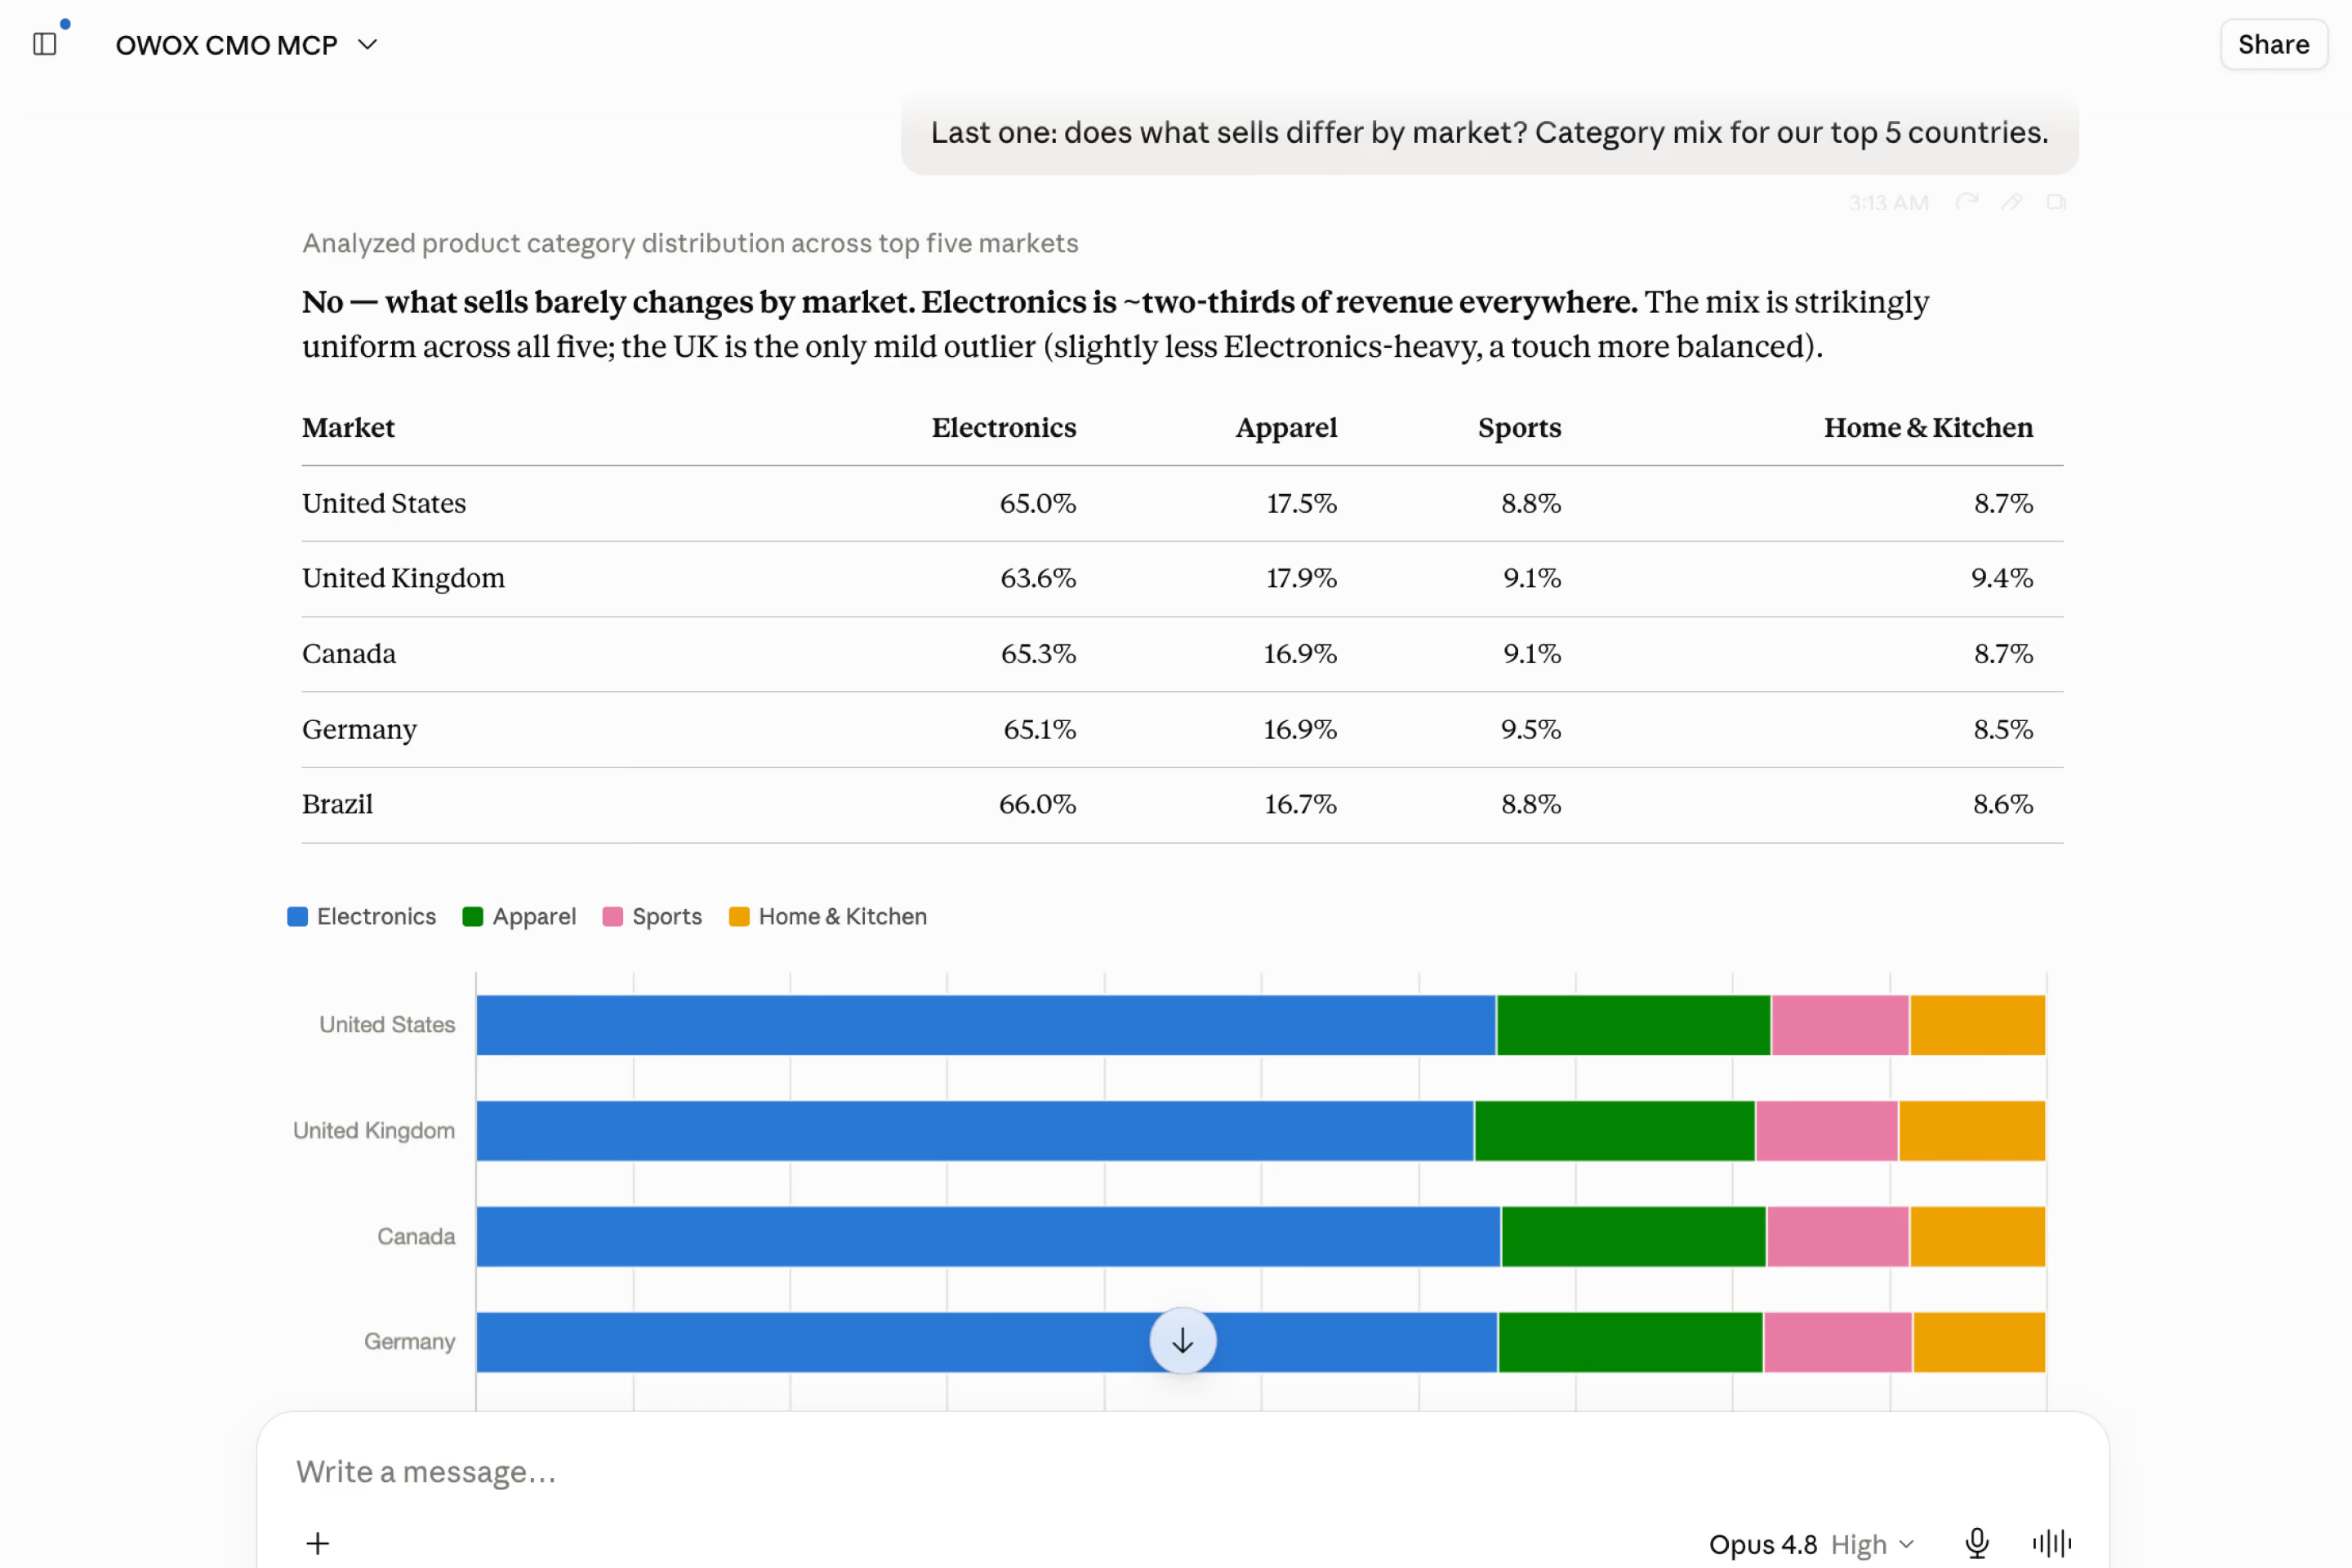
Ask in Claude or ChatGPT: "ROAS by channel this quarter vs last?" You get the answer with a chart — every number computed by SQL your analyst approved, not guessed by the model. This is MCP: your governed Data Marts, live in the AI tools you already use.
- Ask in plain language — "which campaigns actually drove revenue?" — and get a defensible number, not a last-click guess.
- Zero hallucinations: the model narrates, analyst-approved SQL computes. It can't invent a join or a metric. Patented.
- Export any answer straight to a Google Sheet for the board deck.
How it works
From ticket queue to self-service — in three steps
Your data team builds the marketing library. Your marketing team self-serves from it. AI delivers performance briefs. The ticket queue empties.
Step 1
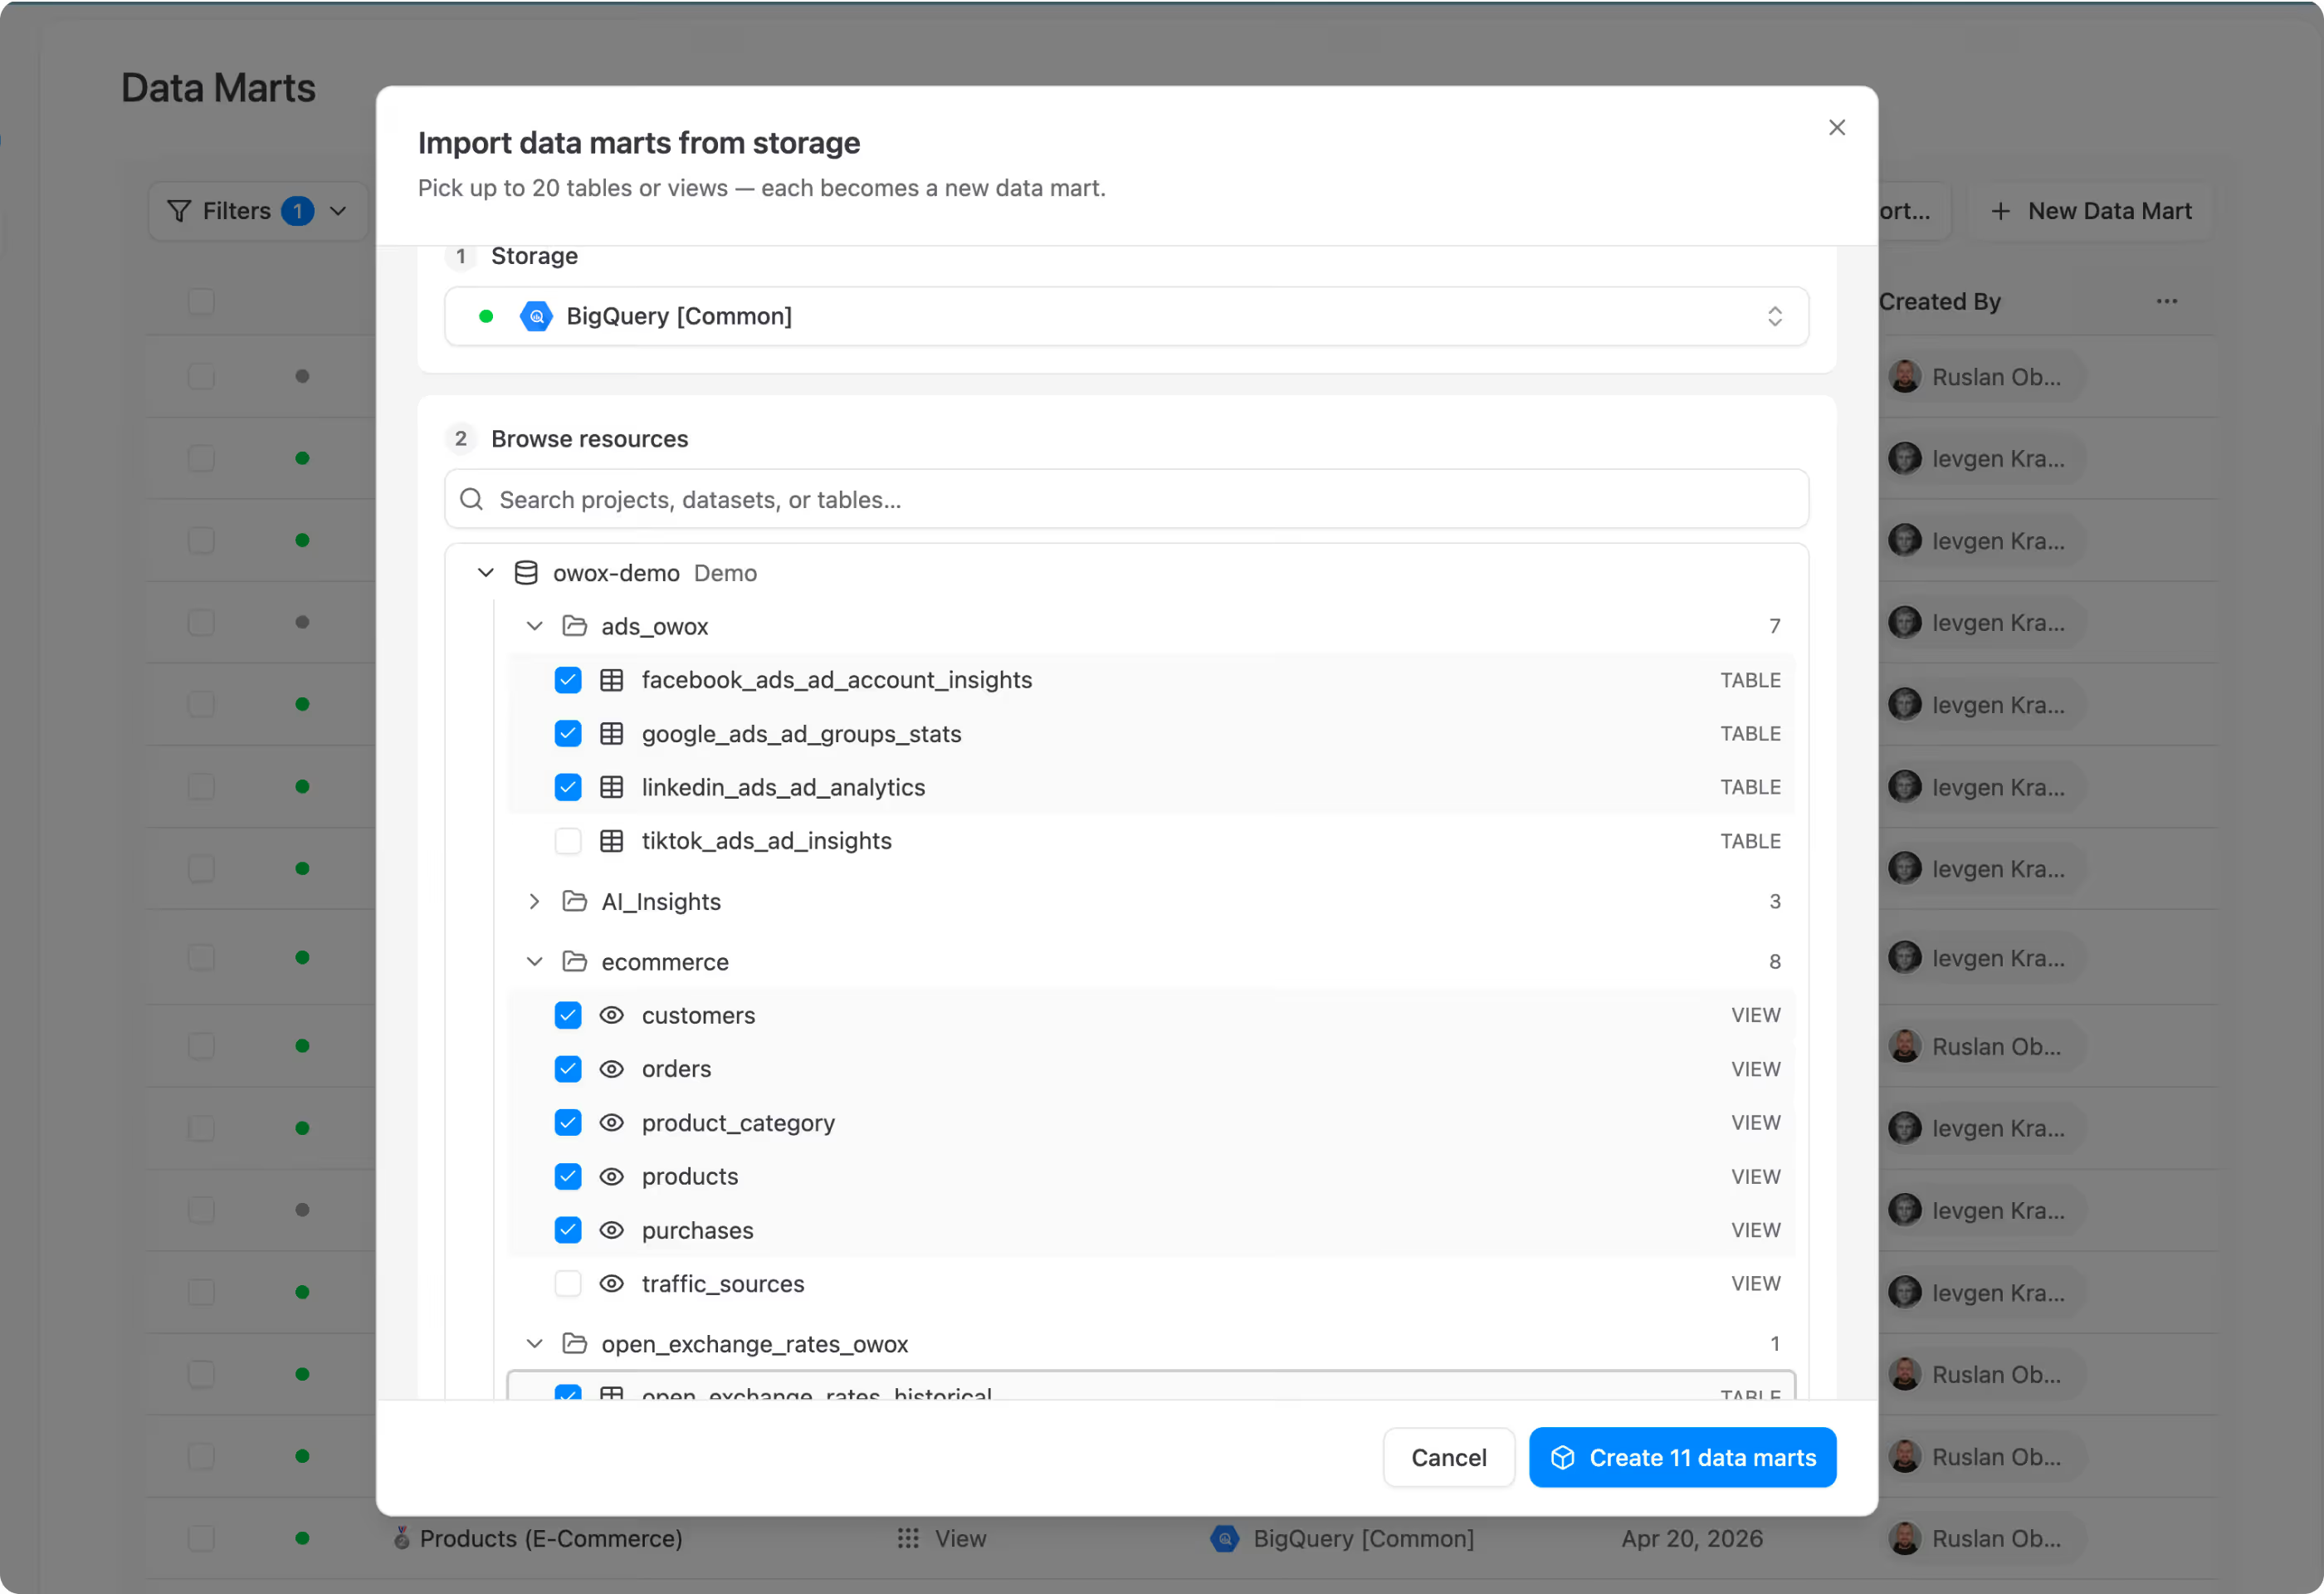
Data team builds the library
Connectors pull ad data into the warehouse. Your analyst joins it with revenue, publishes governed Data Marts.
Step 2
Marketing team self-serves
Campaign managers open Sheets, browse the library, pick columns, filter by platform or region, refresh weekly.
Step 3
AI delires briefs
Performance narrative — spend trends, ROAS changes, anomalies — to your Slack or Email. Or ask your Claude.
What changes for your marketing org
Stop overwhelming the data team
When your marketing team self-serves from governed Data Marts, everything shifts.

Defend your budget with real attribution
Cross-platform spend joined with actual revenue. When the CFO asks "is TikTok working?" – you answer with data.

Numbers that match finance
Marketing and finance pull revenue from the same place. The board meeting goes smoothly because reconciliation doesn't happen at the meeting.

Your analyst works on strategy
When the marketing team stops filing "pull this" tickets, your analyst finally has time for attribution modeling, incrementality testing, and media mix optimization.
What users are saying
What marketing leaders say
Real things real customers said — each quote pinned to a specific claim, straight from the quotes database.
 Mark SimmonsCMO, Pürblack®
“We had six or seven different channels and no single source of truth — it was almost impossible, a lot of guesswork.”
 Nodari RizunFounder & CEO, Pürblack®
“Golden data is clean data — the measure of reality, true and not false, that you can trust based on its source. If you have that, you're good.”
Nodari RizunFounder & CEO, Pürblack®“Most businesses look at a Shopify or Google Analytics dashboard and think it's the source of truth. It's not — that data was never cleaned.”
Customer stories
Marketing teams that stopped filing data tickets
Teams that gave their marketers direct access to governed data
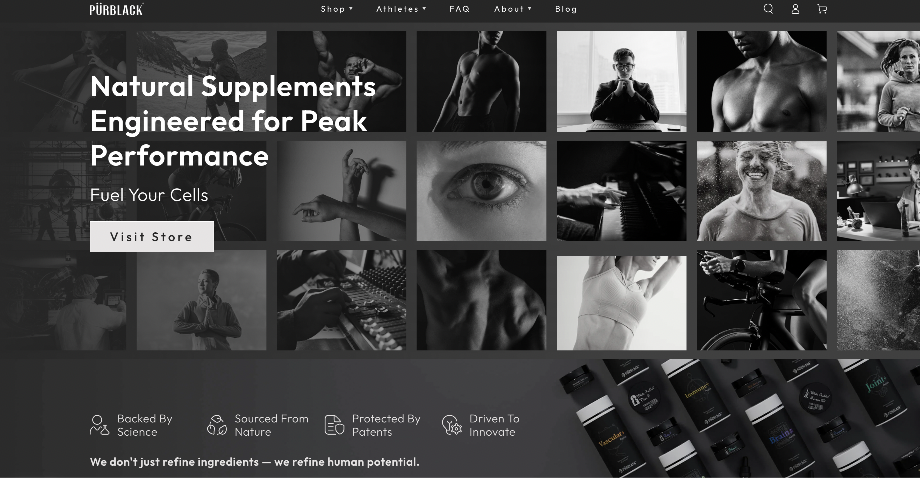 "For 10 years I was blind." The day Pürblack® founder stopped guessingSecondsto get reports across six channelsRead the story
  How OWOX Reports Helped Reformation Make Data-Backed DecisionsMinutesfrom data request to business decisionRead the story
  How OWOX Reports Streamlined Operations for WorkSimpli, Saving Over 10 Hours Weekly10hrs+saved per week on manual reportingRead the story
 WHAT YOUR DATA TEAM DEPLOYS
One hire serves your whole marketing org.
Your data team sets up a Reporting Analyst once: it pulls every ad platform into your warehouse, joins spend with revenue, and publishes a governed library your team self-serves. When you need the “why” — “why did CAC spike on TikTok last week?” — the Senior Analyst answers in Slack, Claude, or ChatGPT, traceable to SQL.

Reporting Data Analyst
Builds your governed marketing library — every ad platform joined with revenue, self-served in Sheets. From $65/mo.

Senior Data Analyst
Answers your team’s “why” in plain language — @owox in Slack, Claude, or ChatGPT. Traceable to SQL. From $90/mo.
FAQ
Questions CMOs ask
My marketing team isn’t technical. Can they actually use this?
The Google Sheets Extension is a column picker inside the tool your team already lives in. They browse a library of Data Marts with names like "Campaign Performance" and "Revenue by Channel," check the columns they want, apply a filter for the platform or date range, and hit refresh. There's no SQL, no query language, no new tool to learn. Your data team sets up the library — that's the technical part. Your marketing team uses it — that's the point-and-click part.
How does this solve the attribution problem?
The attribution problem isn't a methodology problem — it's a data problem. Facebook says it drove the conversion. Google says it did. Neither is lying; they just only see their own touchpoints. OWOX pulls all platform data into one warehouse, joins it with your actual CRM revenue, and lets your analyst define the attribution logic as a Data Mart. One source of truth, one definition, one number.
We already use Looker Studio / Tableau. Why do we need this?
You keep your dashboards. OWOX doesn't replace Looker Studio or Tableau — it sits behind them. OWOX adds a self-service layer: your team gets the same data in Google Sheets with a column picker, so they can explore, filter, and join without modifying the dashboard or filing a ticket. Same Data Mart feeds both — numbers reconcile because the source is the same.
How fast can my team be using this?
Your data team can have the first marketing Data Marts live in a day — connect the warehouse, pull ad platform data via connectors, build the "Campaign Performance" and "Revenue by Channel" Data Marts, publish them. Your marketing team sees the library in Sheets immediately. The AI weekly brief can be delivering to your Slack channel by the following Monday. Full library buildout typically takes a week of analyst time.
What about AI hallucinations in marketing reports?
When someone on your team asks ChatGPT "what's our Facebook ROAS?", the LLM generates a SQL query on the fly. It might join the wrong tables, confuse cost columns, or hallucinate a metric that doesn't exist. OWOX works the opposite way. Your analyst writes the SQL, tests it, publishes it as a Data Mart. When your campaign manager pulls ROAS in Sheets, the number comes from that pre-approved query — deterministic, identical every time. AI Insights narrate the trends but the numbers are computed by SQL, not guessed by AI. Patented technology.
What does this cost compared to analyst time we’re burning?
Most marketing orgs burn 15–25 analyst hours/week on data extraction. At $60/hour, that's $3,600–$6,000/month in analyst time spent pulling data, not analyzing it. OWOX is free to start — 30 one-time credits, no credit card. The Reporting Analyst tier is from $65/month. Senior Analyst from $90/month. Enterprise is custom. Even the Reporting Analyst pays for itself if it saves your analyst 2 hours/month — which it will in the first day. The question isn't "can we afford OWOX?" — it's "can we afford to keep our analyst as a human CSV export?"