
Solution
NewEvery stakeholder gets their own Reporting Analyst in Google Sheets
Don't hire another analyst. Give every team a Reporting Analyst instead.
OWOX turns your warehouse into a governed system where every stakeholder — marketing, sales, ops, the CEO — gets a dedicated Reporting Analyst in Google Sheets. Joinable Data Marts, a column picker, deterministic briefings on schedule. No hallucinations. No analyst queue.
The analytics system 170,000 spreadsheet users already trust
Marketplace users
175K+
teams running OWOX from the Google Workspace Marketplace
G2 rating
4.9
296 verified reviews on G2
Connector downloads
156K+
open-source connector installs via npm
GitHub stars
231
the platform is open source — star it, fork it, self-host it
The hiring trap
You’re about to make the most expensive mistake in analytics
Demand for data keeps growing. Your team can’t keep up. The instinct is to hire — another analyst, another tool, another dashboard layer. But headcount doesn’t scale analytics. A system does.
What you’re doing now
Throwing headcount at a systems problem
- Every new team, client, or initiative means another analyst request — or a six-month wait
- Business users build their own reports in ChatGPT, Claude, or ad-hoc exports — your numbers diverge
- Your best analysts spend their days running the queue, not building the system
- AI tools promise answers but hallucinate numbers — and nobody catches it until a board meeting
- You can’t prove ROI on analytics because the team is buried in tickets, not delivering insights
With OWOX
Every team member gets a Reporting Analyst.
- A joinable Data Mart library in Google Sheets — every stakeholder picks columns and builds reports without SQL
- AI Insights delivered on schedule to Slack, Teams, or email — deterministic, not hallucinated
- One analyst’s work serves the whole company — the CEO, marketing, sales, ops, all from the same library
- Your data team builds the system once — it scales without hiring
- Every number has an owner, every cell traces to SQL — governance is built in, not bolted on
You don't need more analysts. You need one Reporting Data Analyst that serves every team — and scales without hiring more.
WHICH ANALYST YOU'RE HIRING
Start free. Scale the hire when you're ready.
Each “hire” is a set of skills a data analyst does by hand today — automated, governed by your team, and ready from day one.

DATA INTERN
The on-ramp. Pulls and blends your data; every number traces to SQL.

REPORTING ANALYST
Builds the governed Data Mart library. Every team self-serves in Sheets. Kills the reporting queue. You’re here.

SENIOR ANALYST
When teams need to ask “why” in plain language — @owox answers in Claude, or ChatGPT. Never hallucinates.
F05 · The system
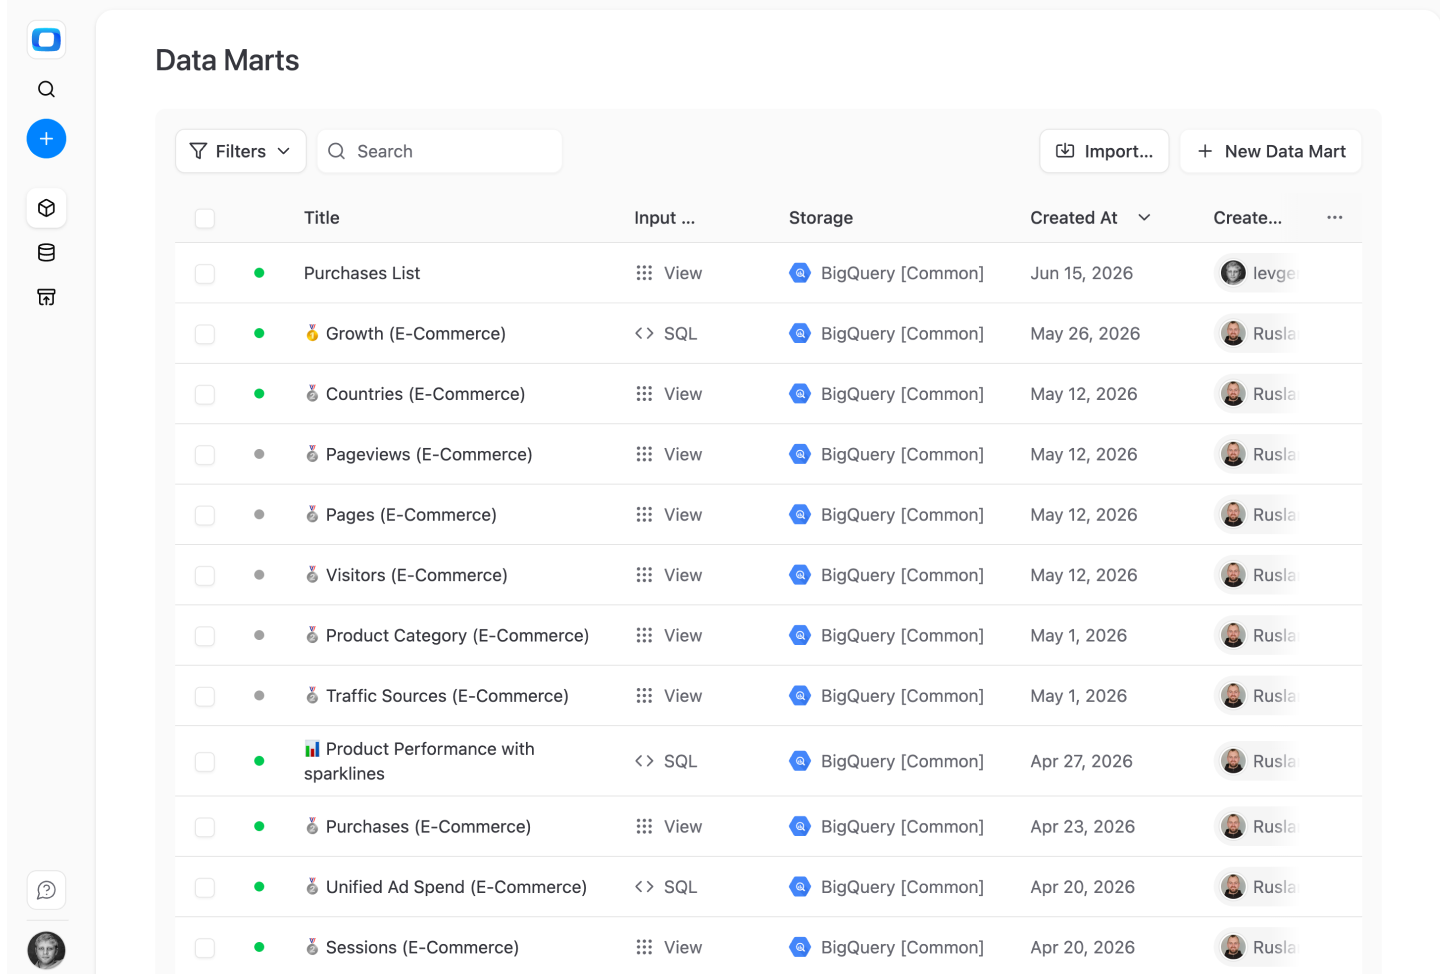
One analyst’s library serves the entire company
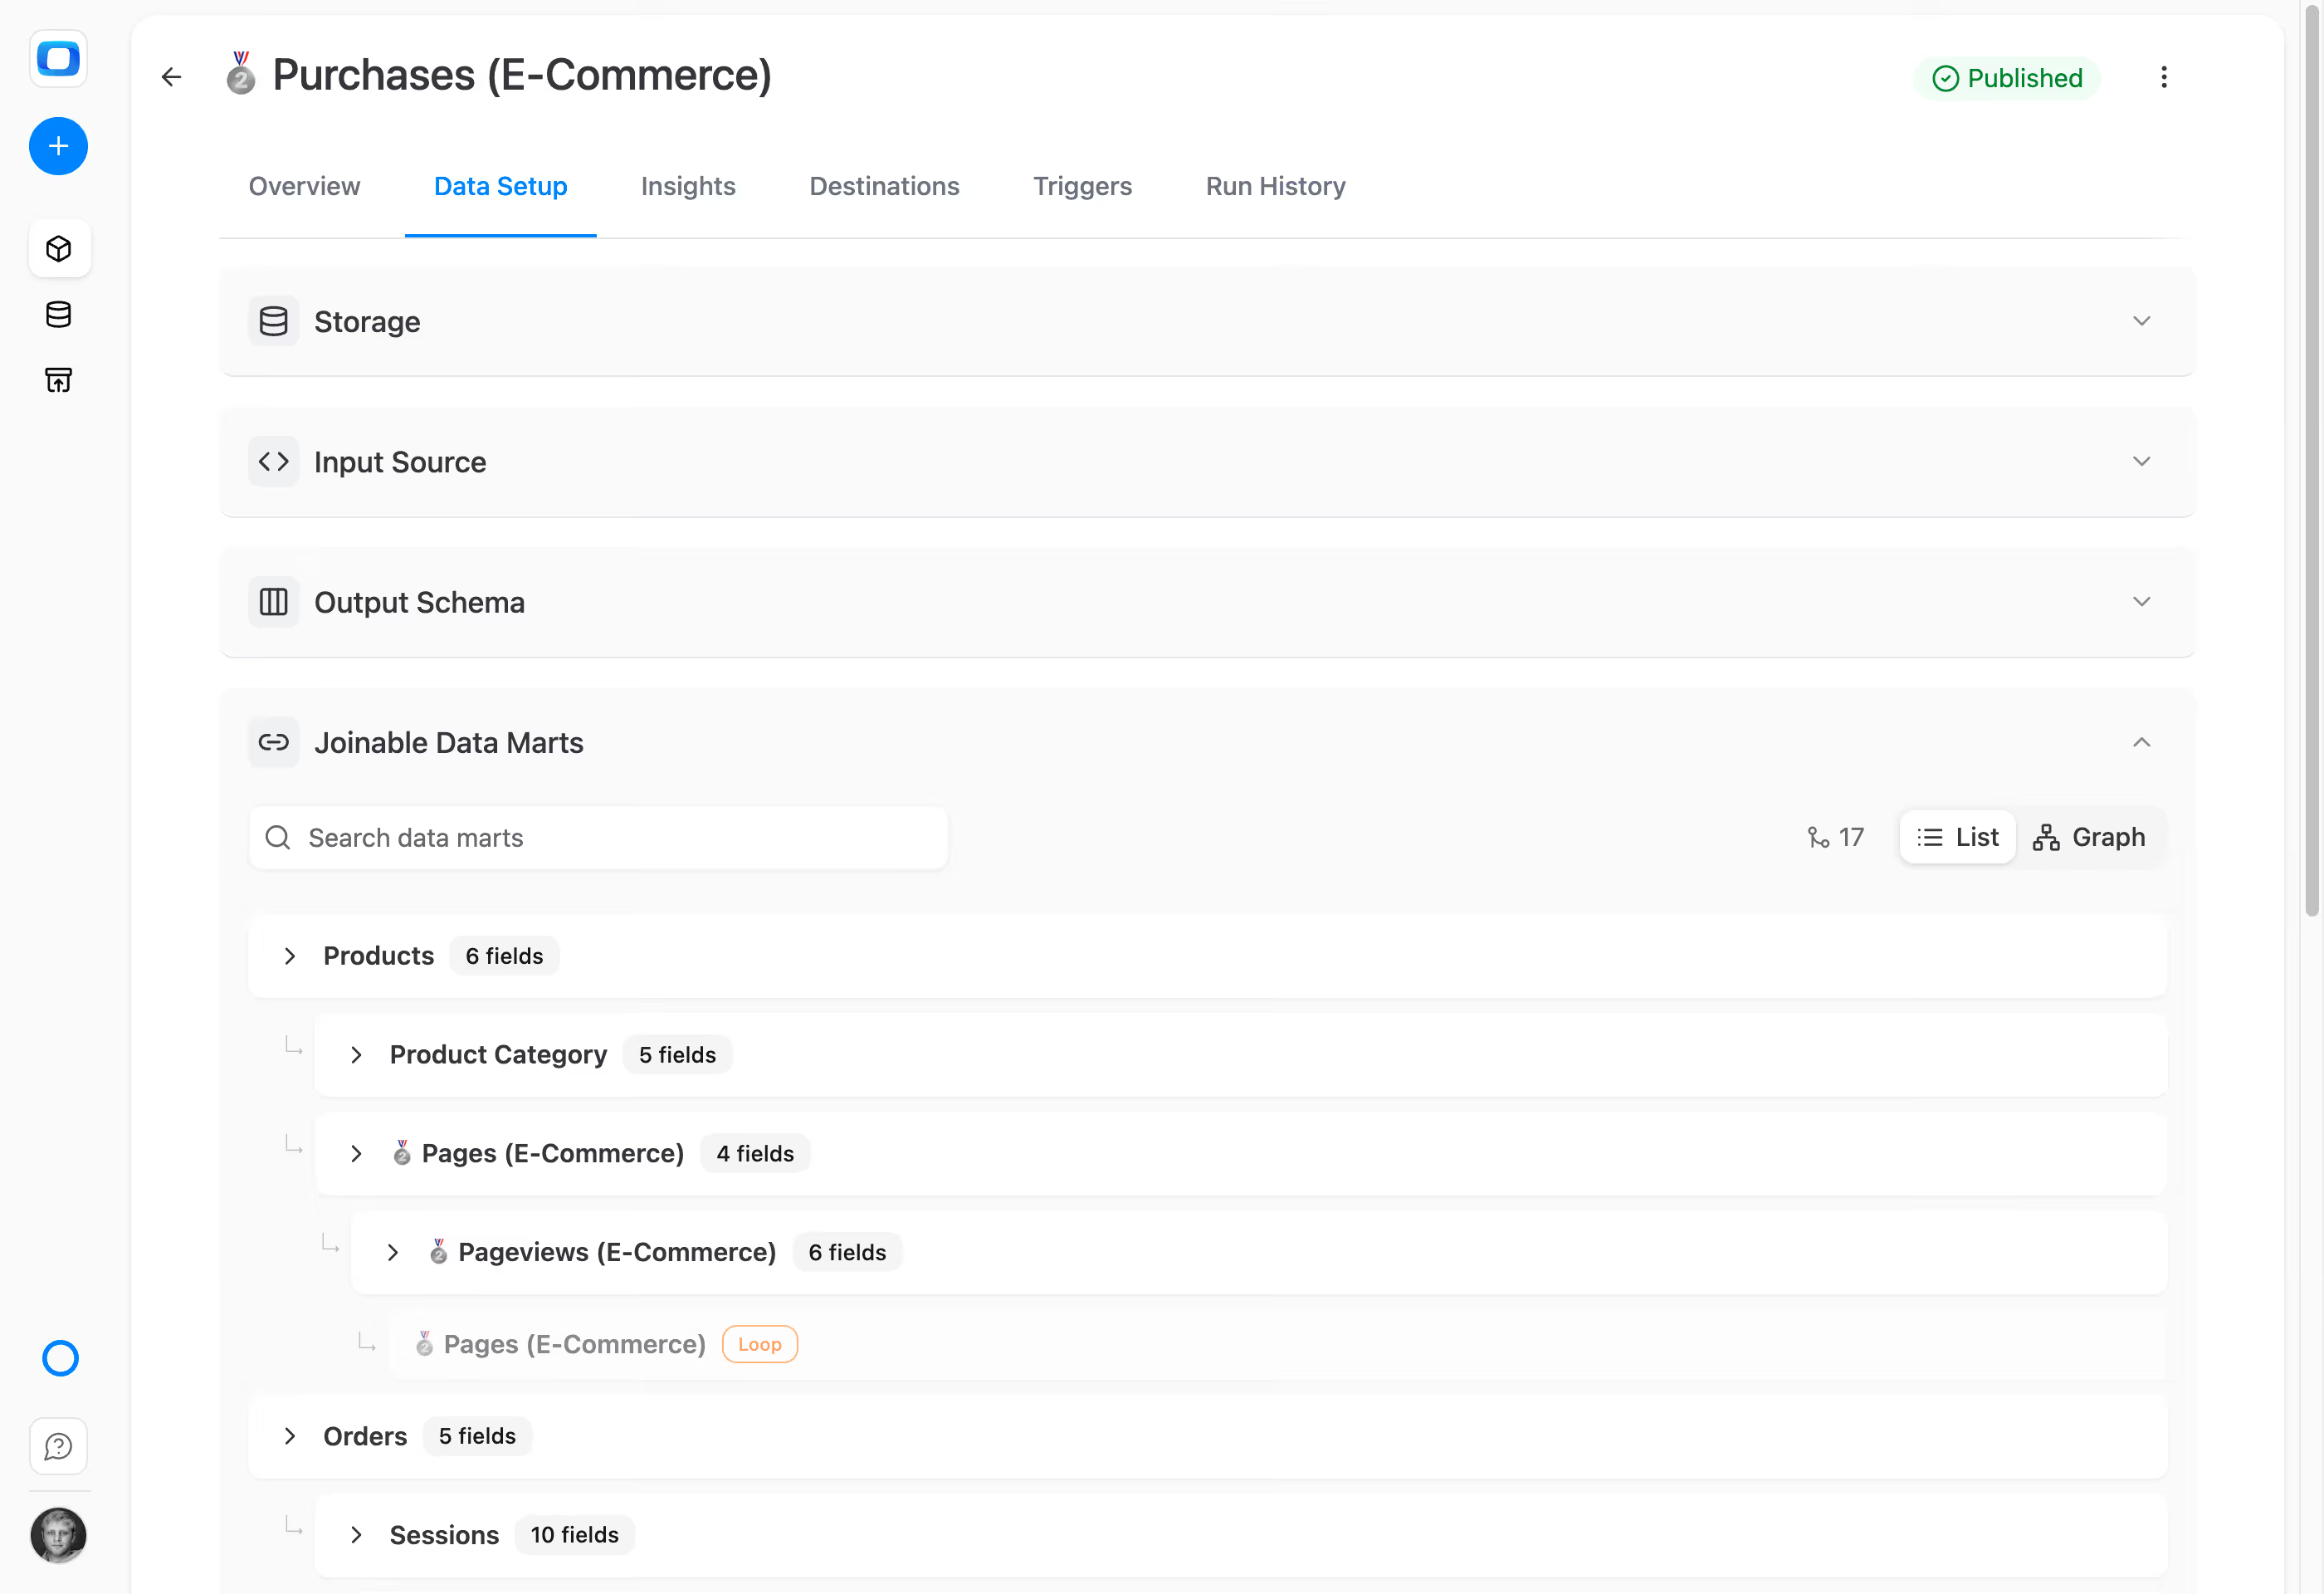
Your data team picks tables from the warehouse and one-click populates a governed Data Mart library — descriptions, aliases, join keys, and ownership auto-generated. Every team in the company self-serves from the same source of truth.
- Auto-generated governance — aliases, descriptions, join keys, owners on every Data Mart
- One library serves marketing, sales, finance, ops, and leadership — no duplicated logic
- New team needs data? They browse the library — no analyst ticket required
F06 · THE HIRE
A Reporting Analyst for every team member
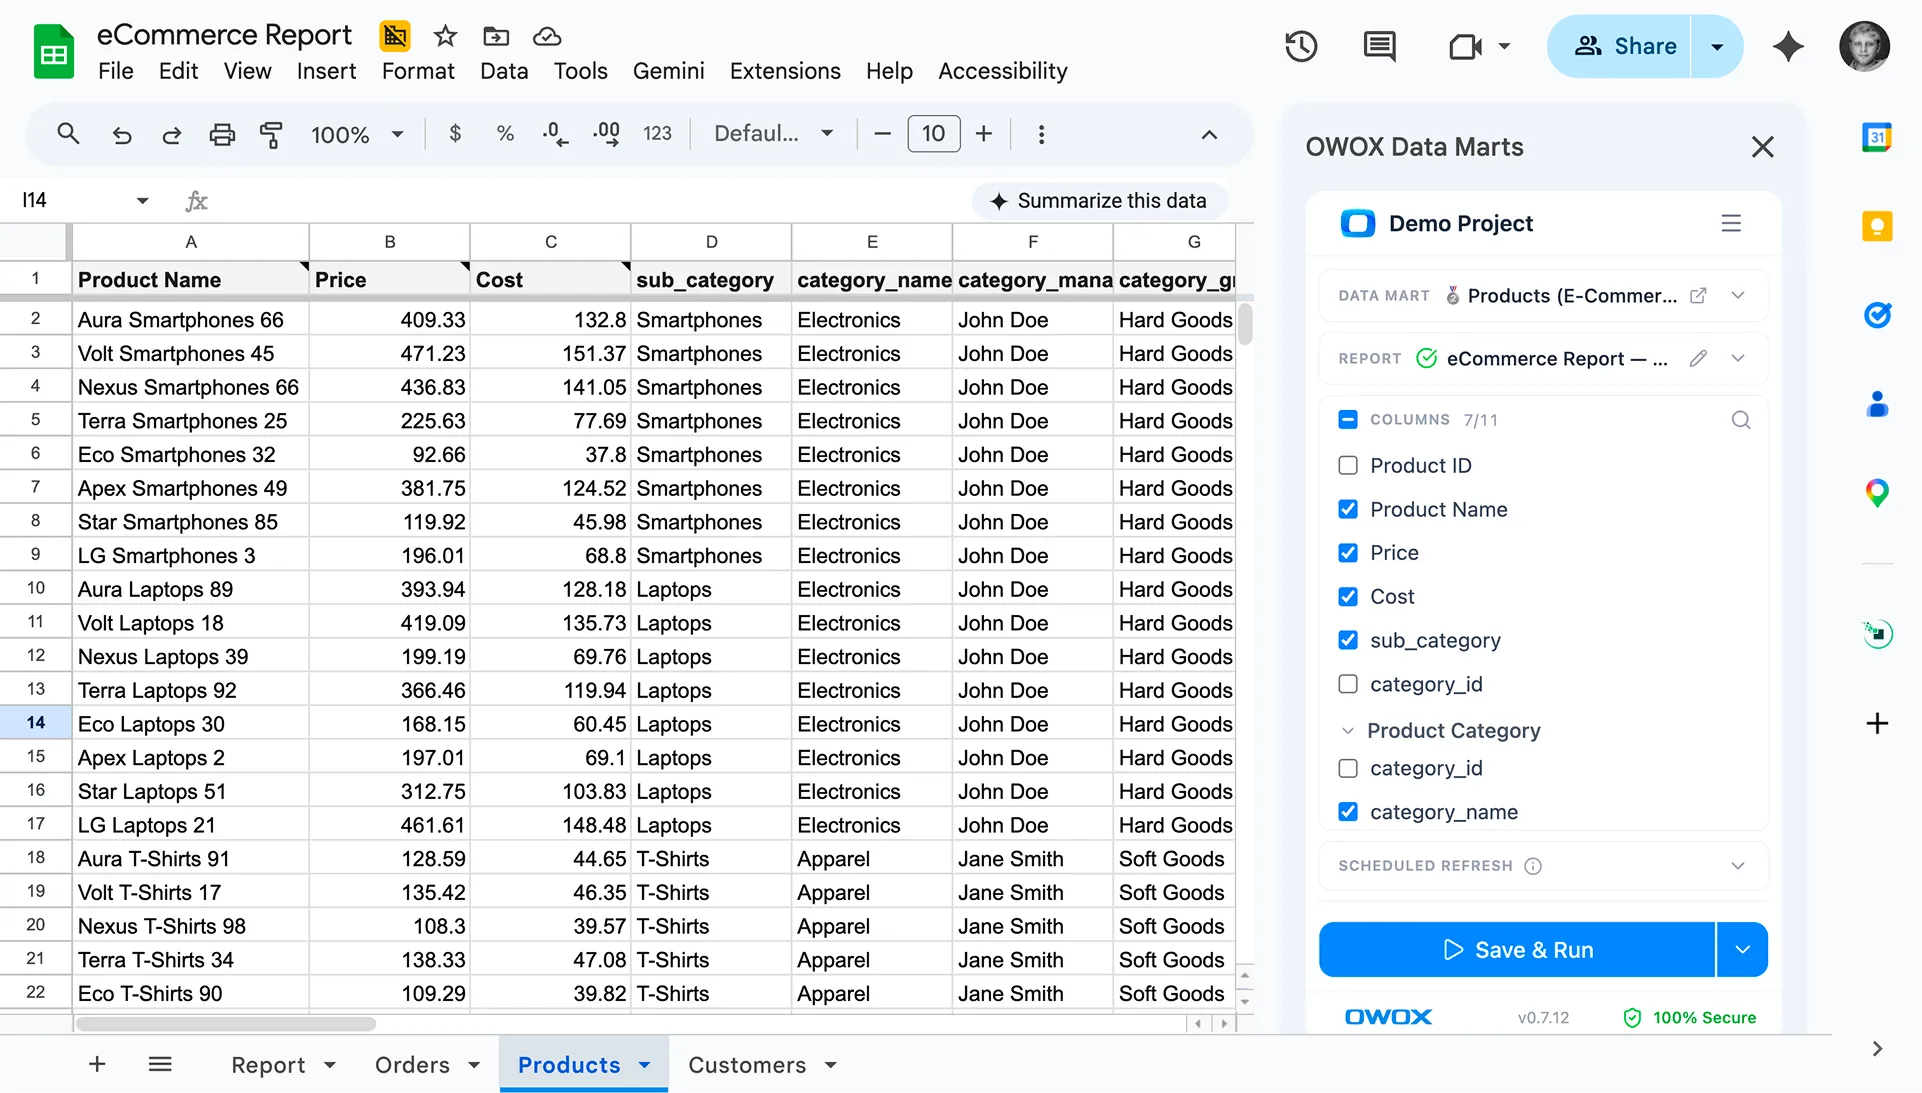
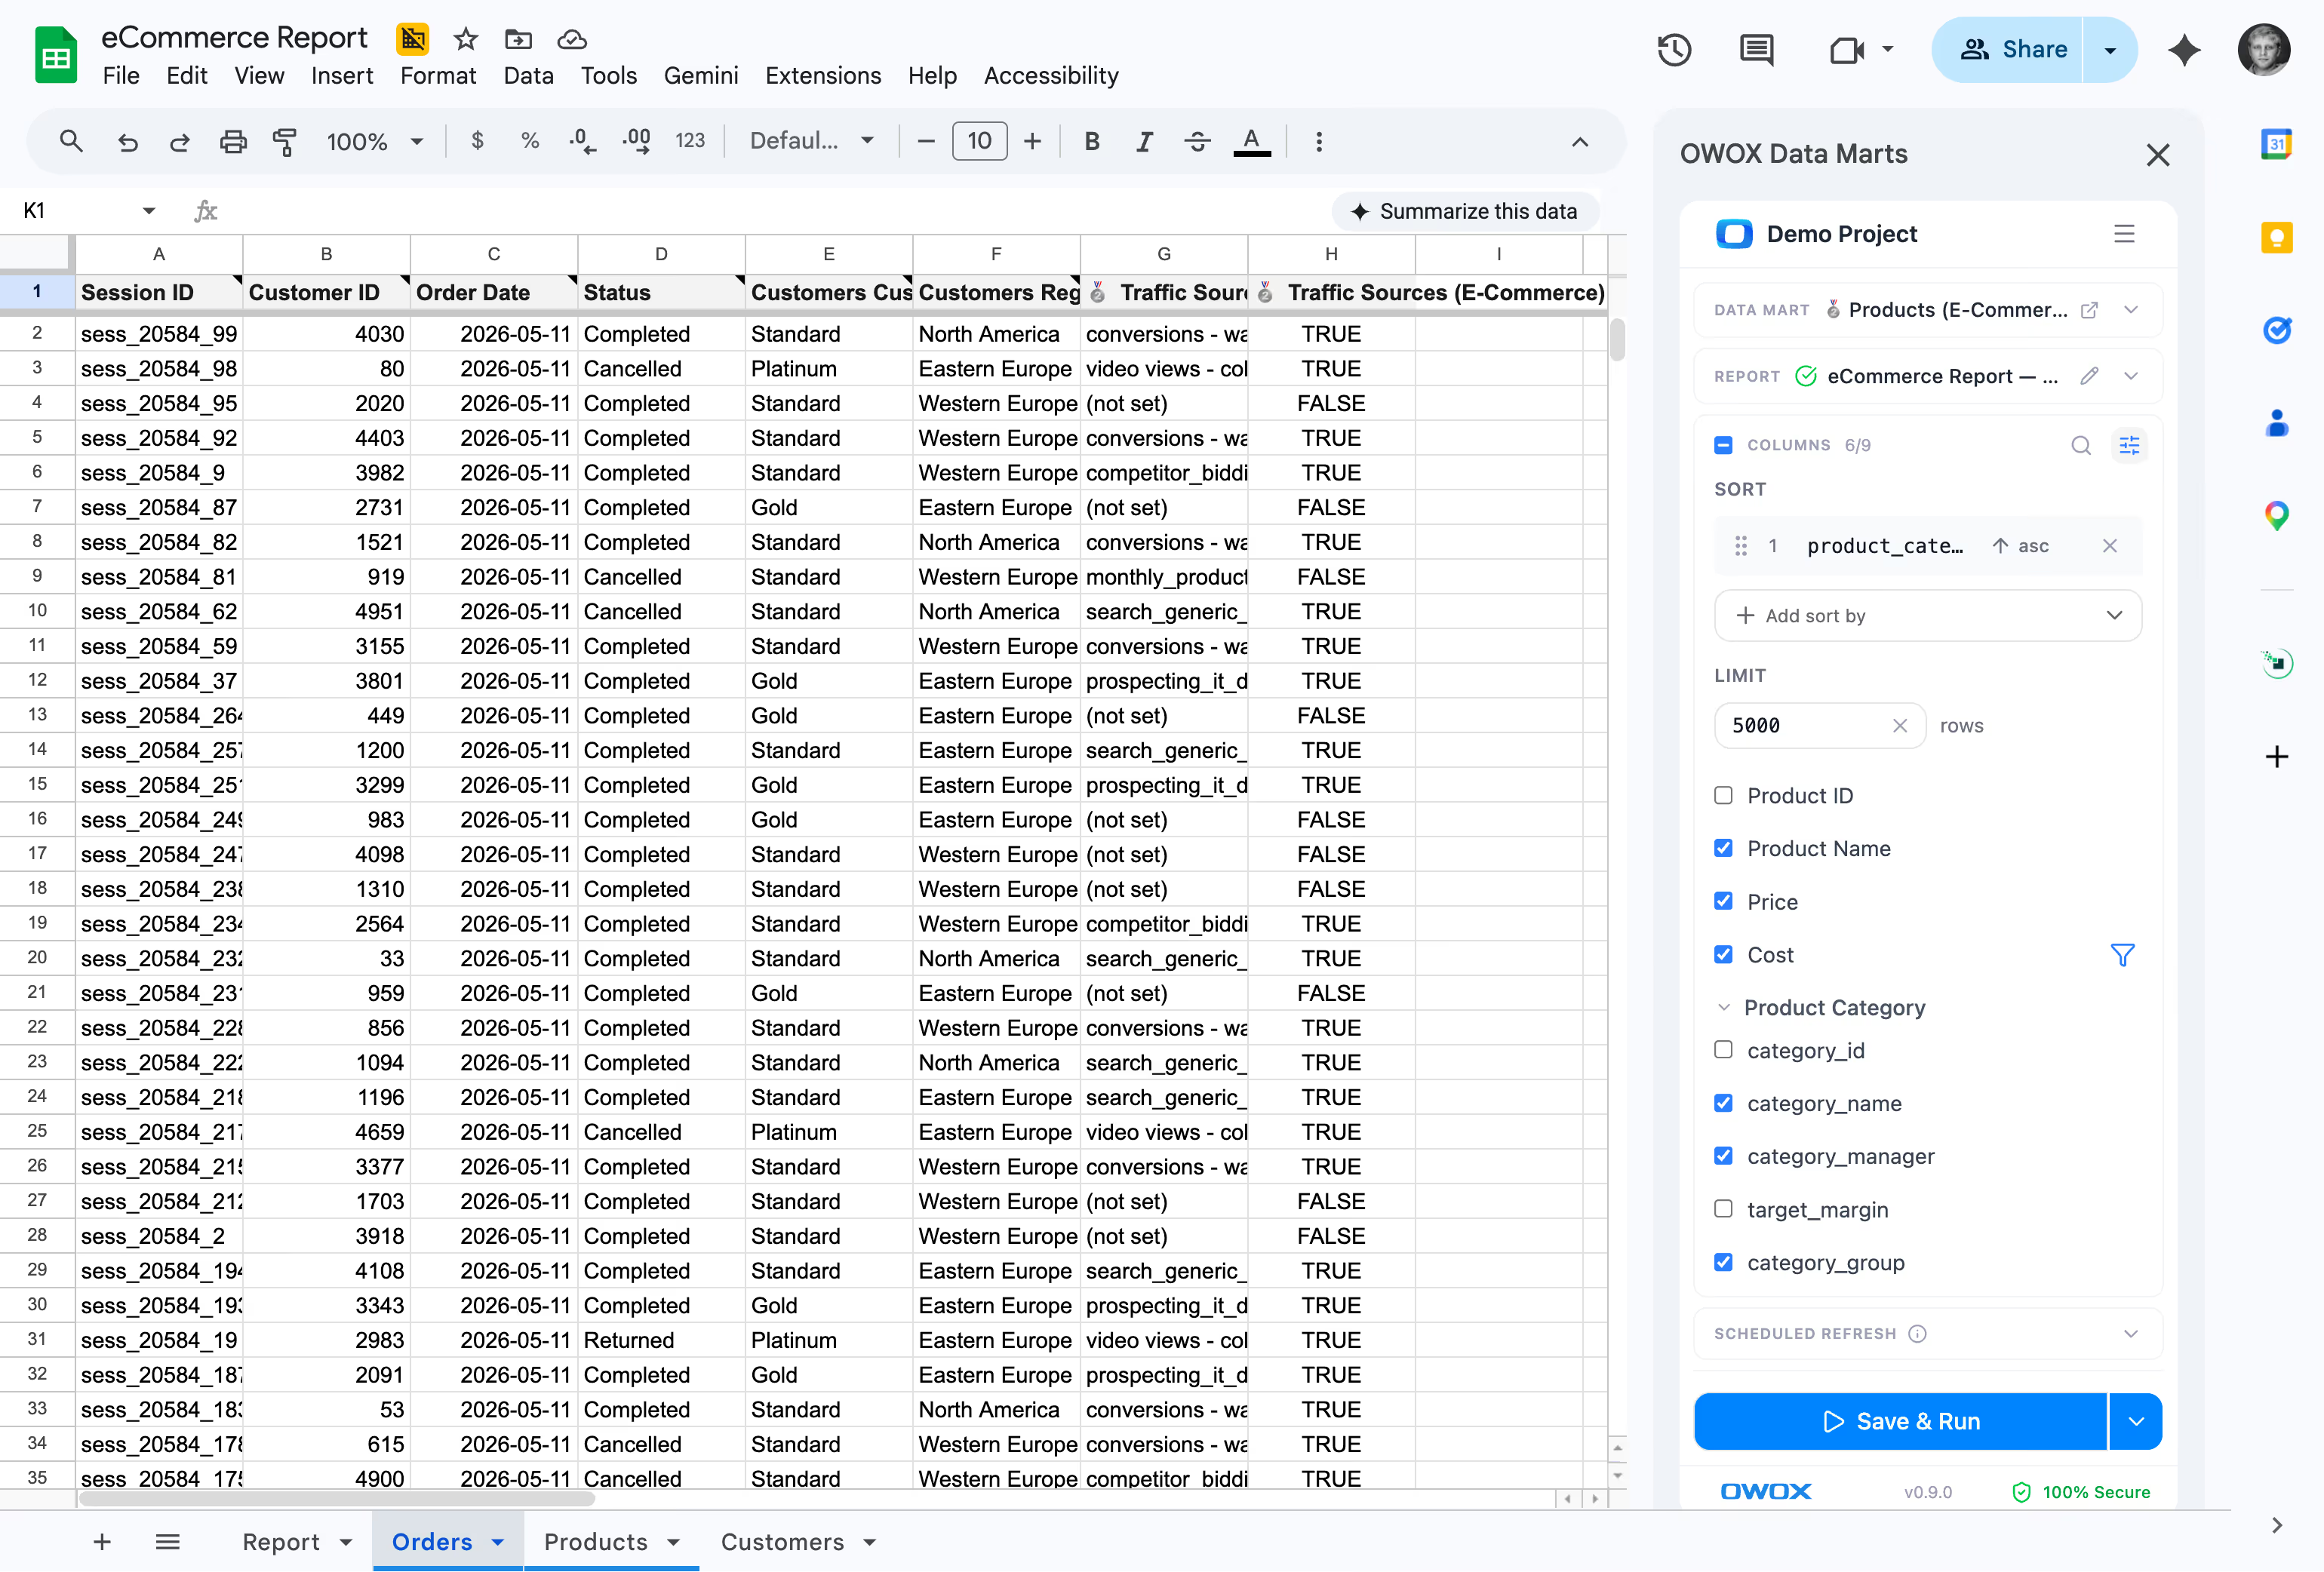
The OWOX extension sidebar puts the Data Mart library inside Google Sheets. Every stakeholder browses, joins Data Marts by analyst-defined keys, picks columns, and refreshes — 24/7. The Reporting Analyst who built the library serves every user, simultaneously.
- Business users join Data Marts by pre-approved keys — no AI-generated queries that drift between runs
- Column picker shows only what the data team published — no raw tables, no accidental exposure
- Every cell is deterministic, traceable, verifiable — patented technology, zero hallucinations
F07 · GOVERNED AI, ON YOUR TERMS
Your library is now answerable in their own AI chat — and you still own every number.
When you publish a Data Mart, you also decide what the org can ask of it. Through MCP, stakeholders ask their business a question in Claude, ChatGPT, Slack, or Teams; OWOX builds the query deterministically over the marts and joins you approved. The LLM narrates. It never writes a join you didn't authorize.
- You choose which marts are exposed to AI.
- Every answer traces back to your SQL.
- The assistant can't improvise a metric — it reads your library, nothing else.
F08 · RUN HISTORY
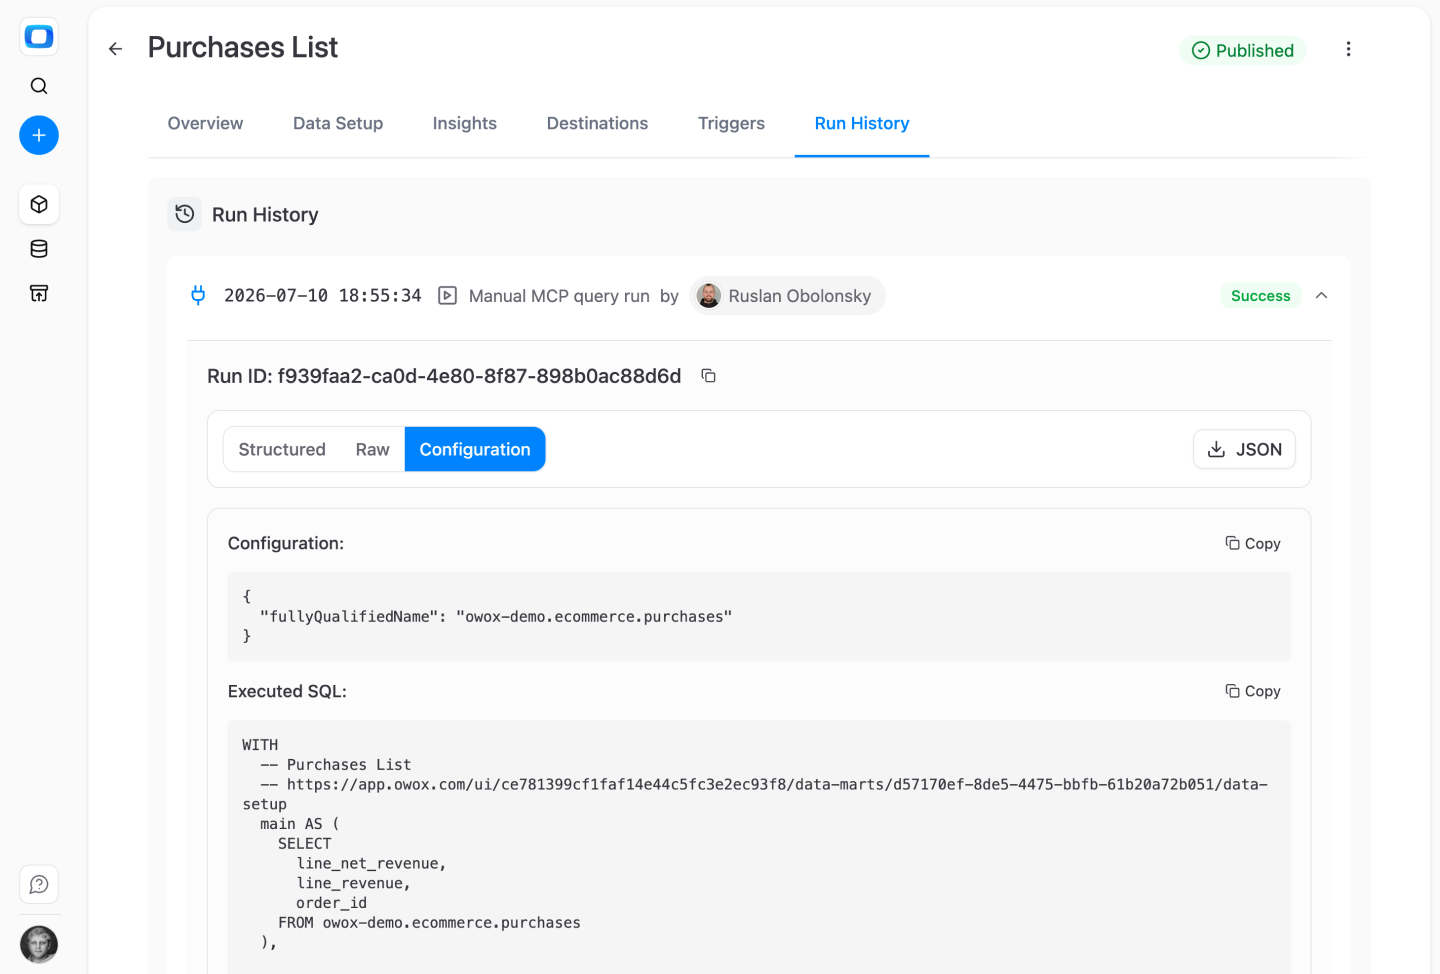
See every AI query — including the ones that tried to invent a field.
Every question the org asks through AI lands in Run History with the exact SQL that answered it. You review what's being asked, spot gaps, and catch the moment an assistant reaches for a field you never published. You're not bypassed — you're the audit layer.
- See every AI query, in order
- Every answer's SQL, attached
- You become the indispensable gatekeeper, not the bottleneck
F09 · The insights
Briefings on a schedule. Deterministic. Zero hallucinations.
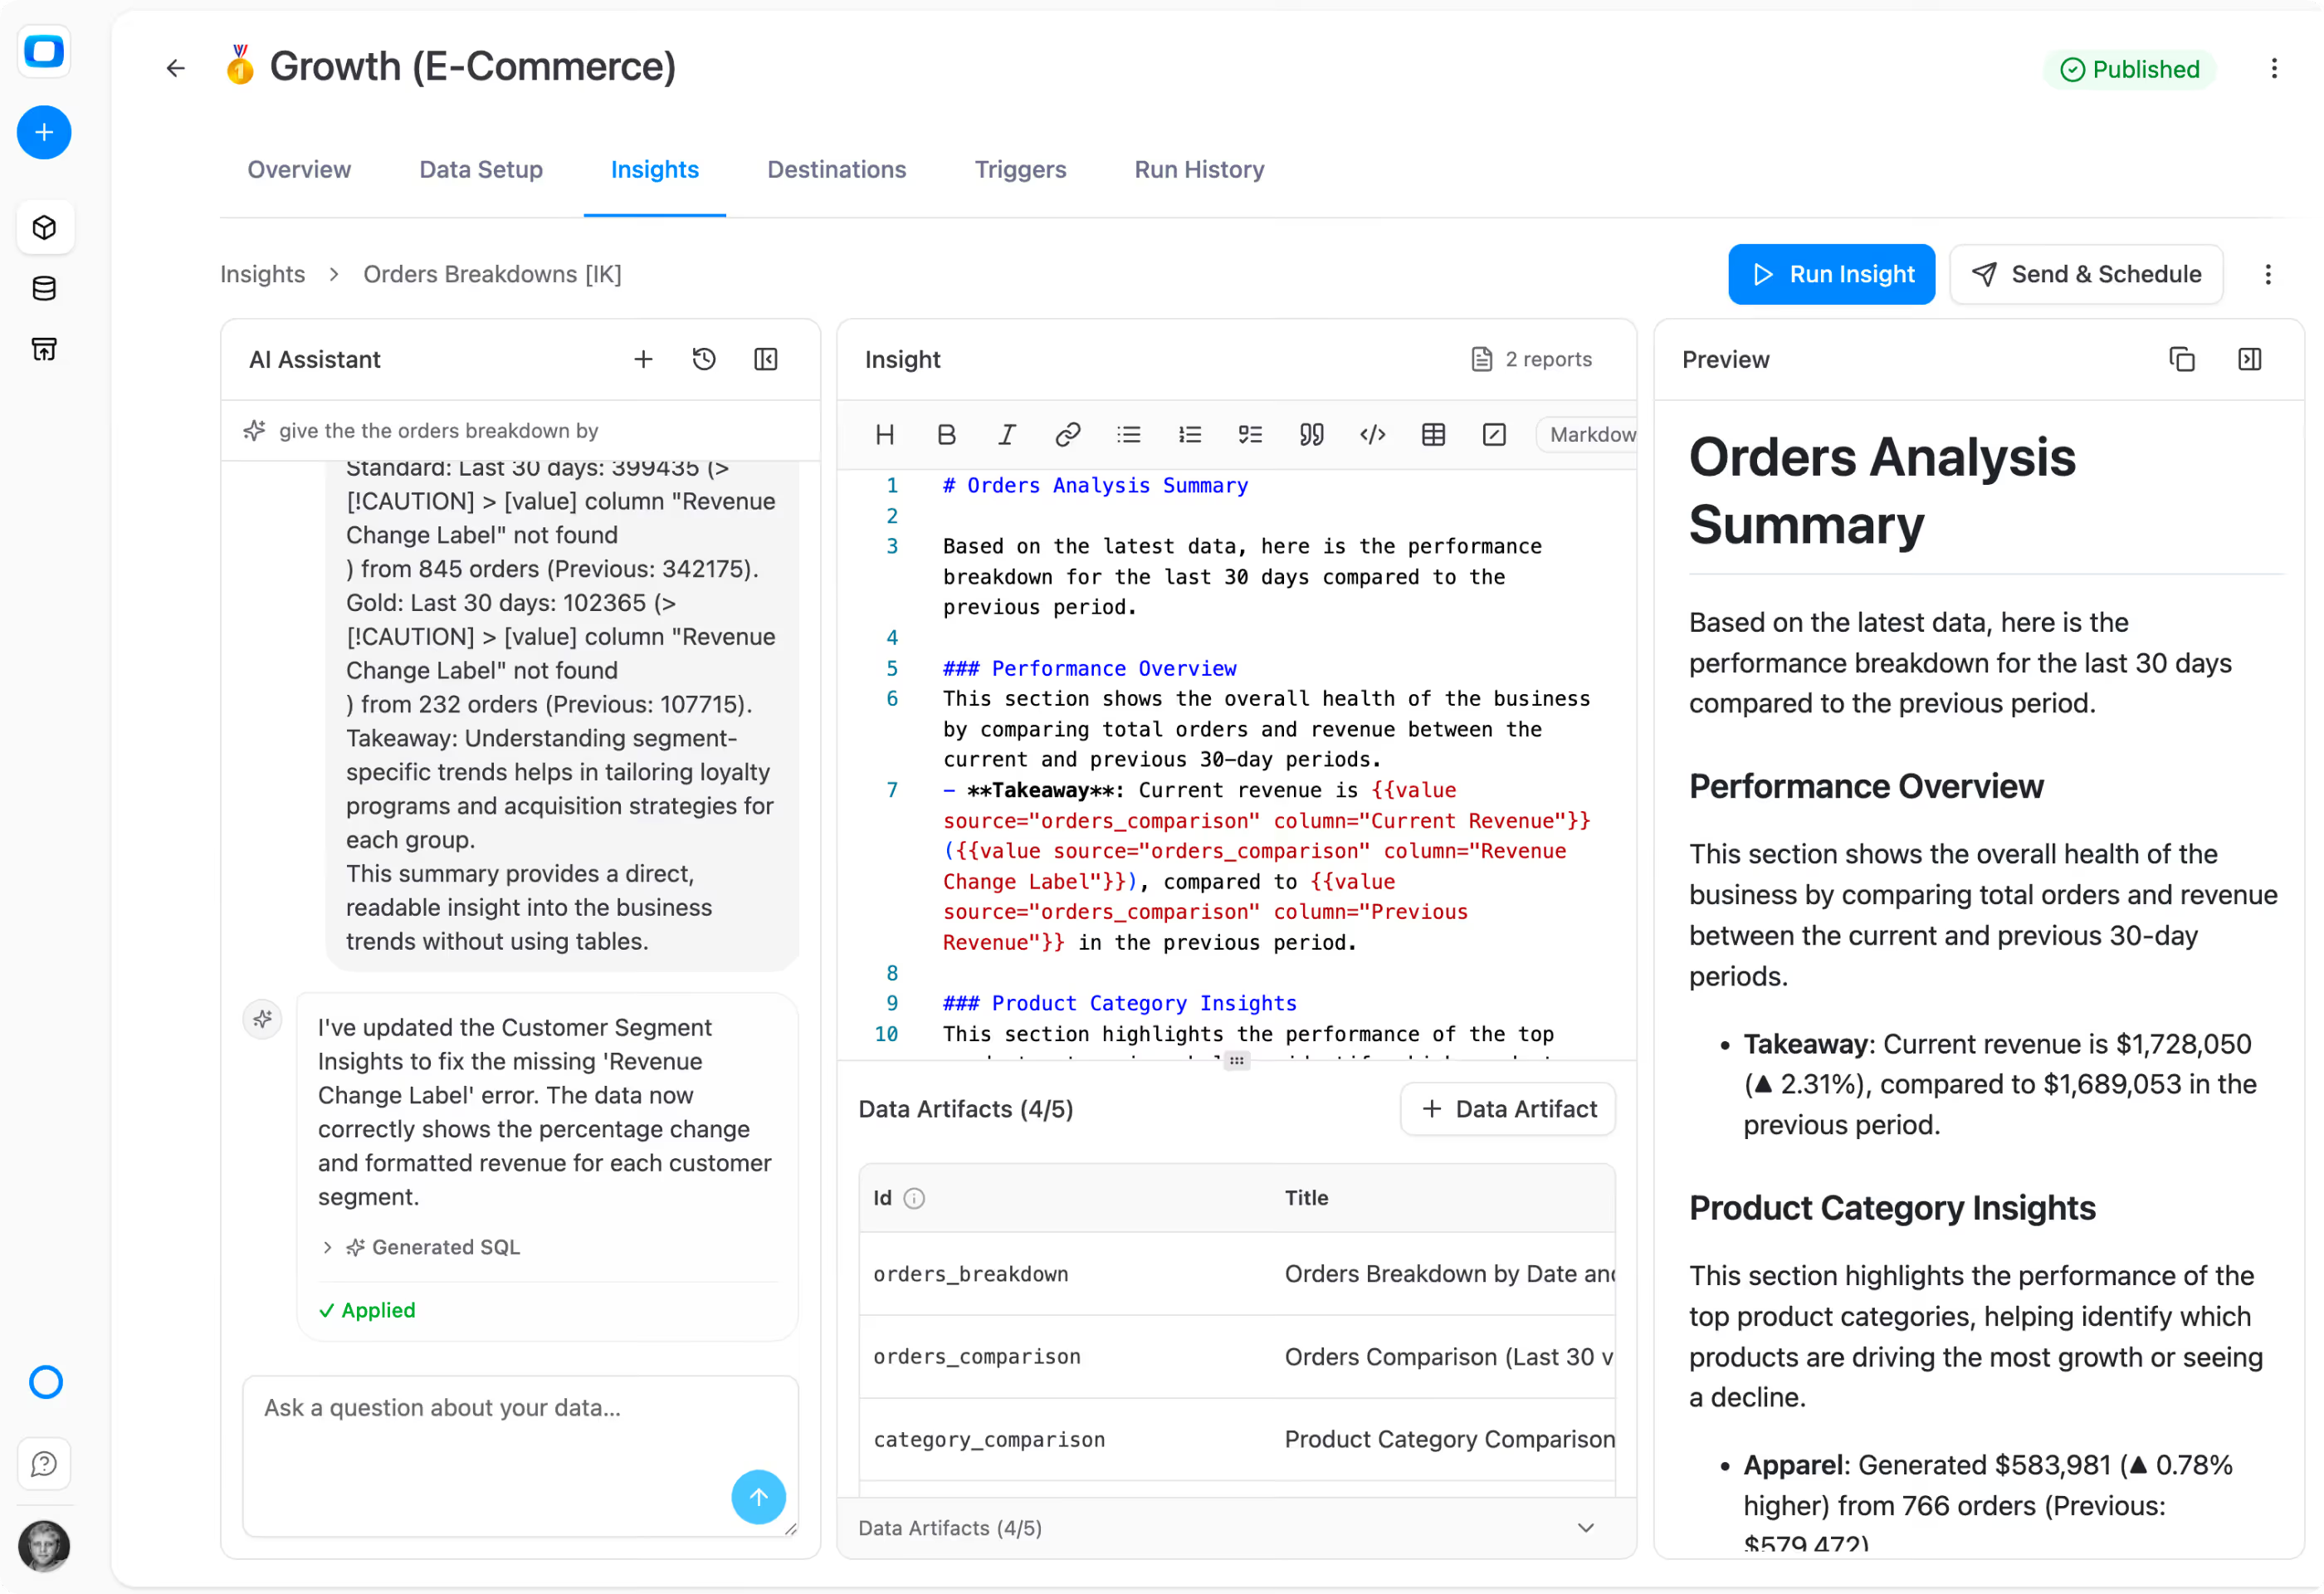
Insights turn Data Mart output into recurring executive narratives — delivered to Slack, Teams, or email on schedule. AI writes the prose. Your analyst approves the SQL. Every number is the result of a deterministic query, not an LLM guess.
- Markdown templates with data placeholders filled by analyst-approved SQL
- Delivered on schedule — Monday morning leadership brief, Friday ops recap, daily marketing pulse
- Patented technology — AI narrates, never invents the numbers
How it works
From analyst bottleneck to company-wide self-service — in three steps
Your data team builds the library. Every team member in the company self-serves from it. AI delivers insights on schedule. The hiring gap closes without a single new hire.
Step 1
Build the library once
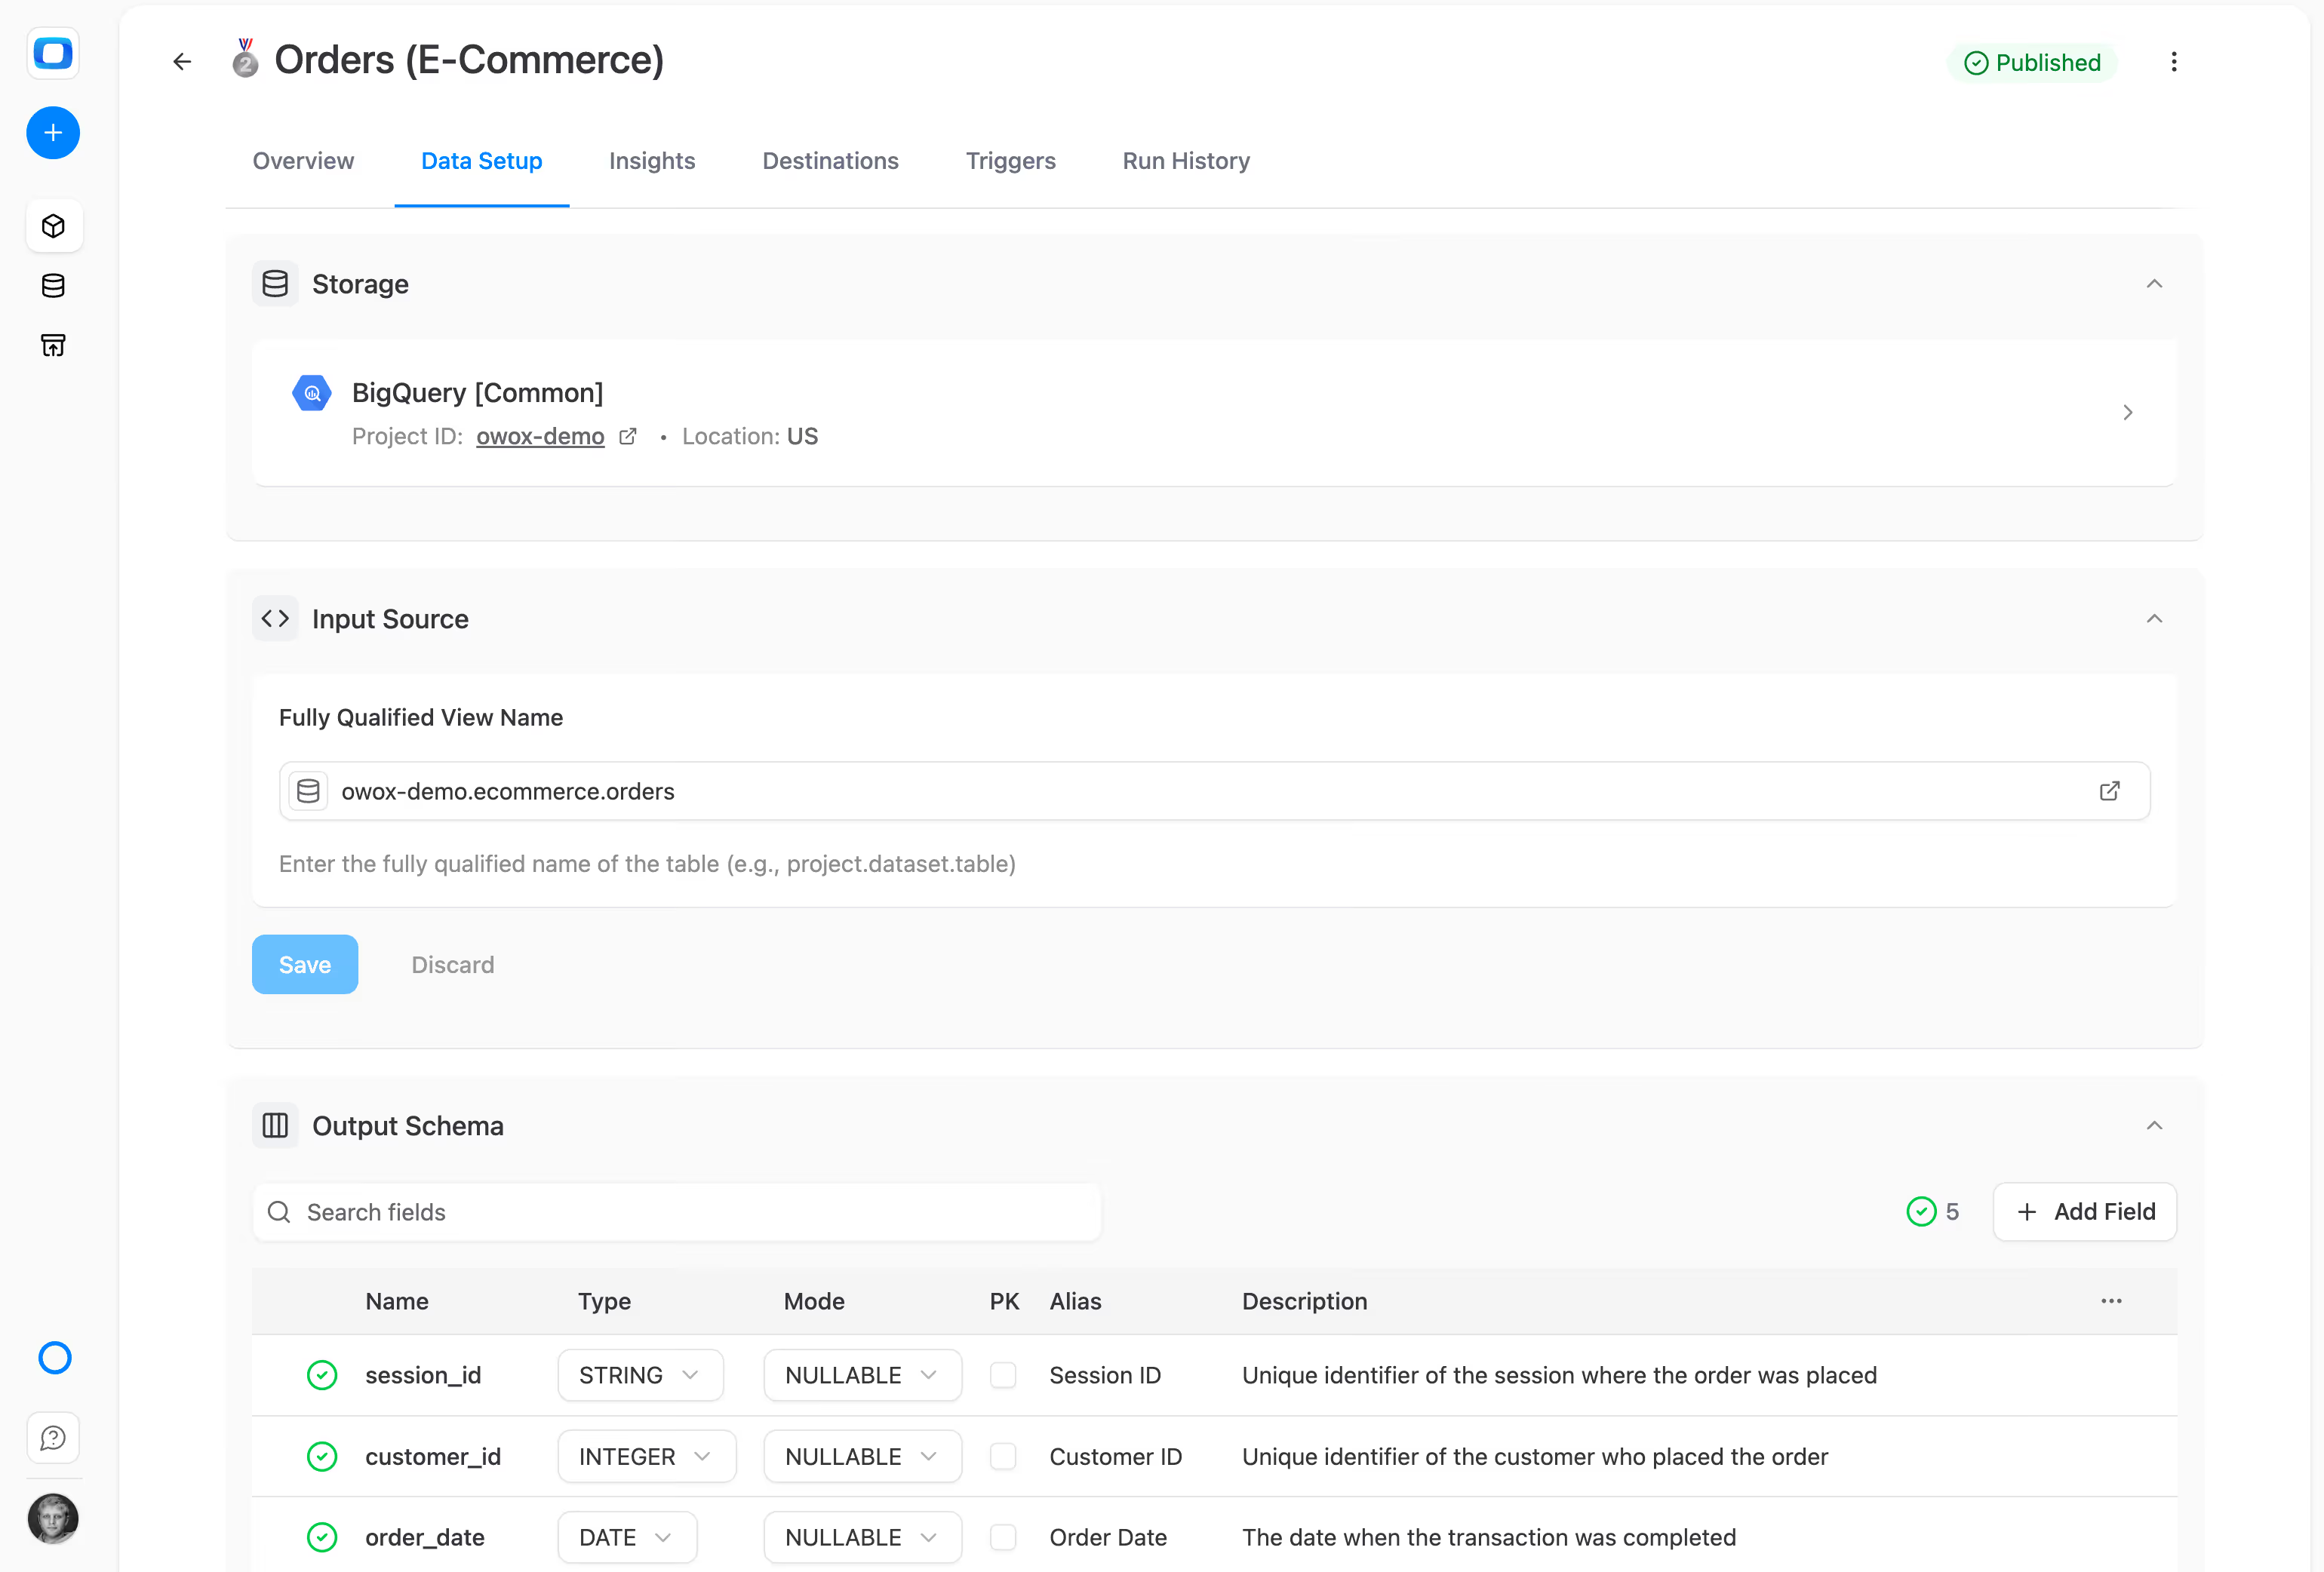
Your data team picks tables or pastes SQL. OWOX auto-generates governance — aliases, join keys, descriptions, ownership. A governed library in one click.
Step 2
Every team member self-serves
The Sheets Extension puts the library inside Google Sheets. Marketing, sales, finance, leadership — everyone browses, joins, picks columns, and refreshes. No tickets.
Step 3
AI delivers insights on schedule
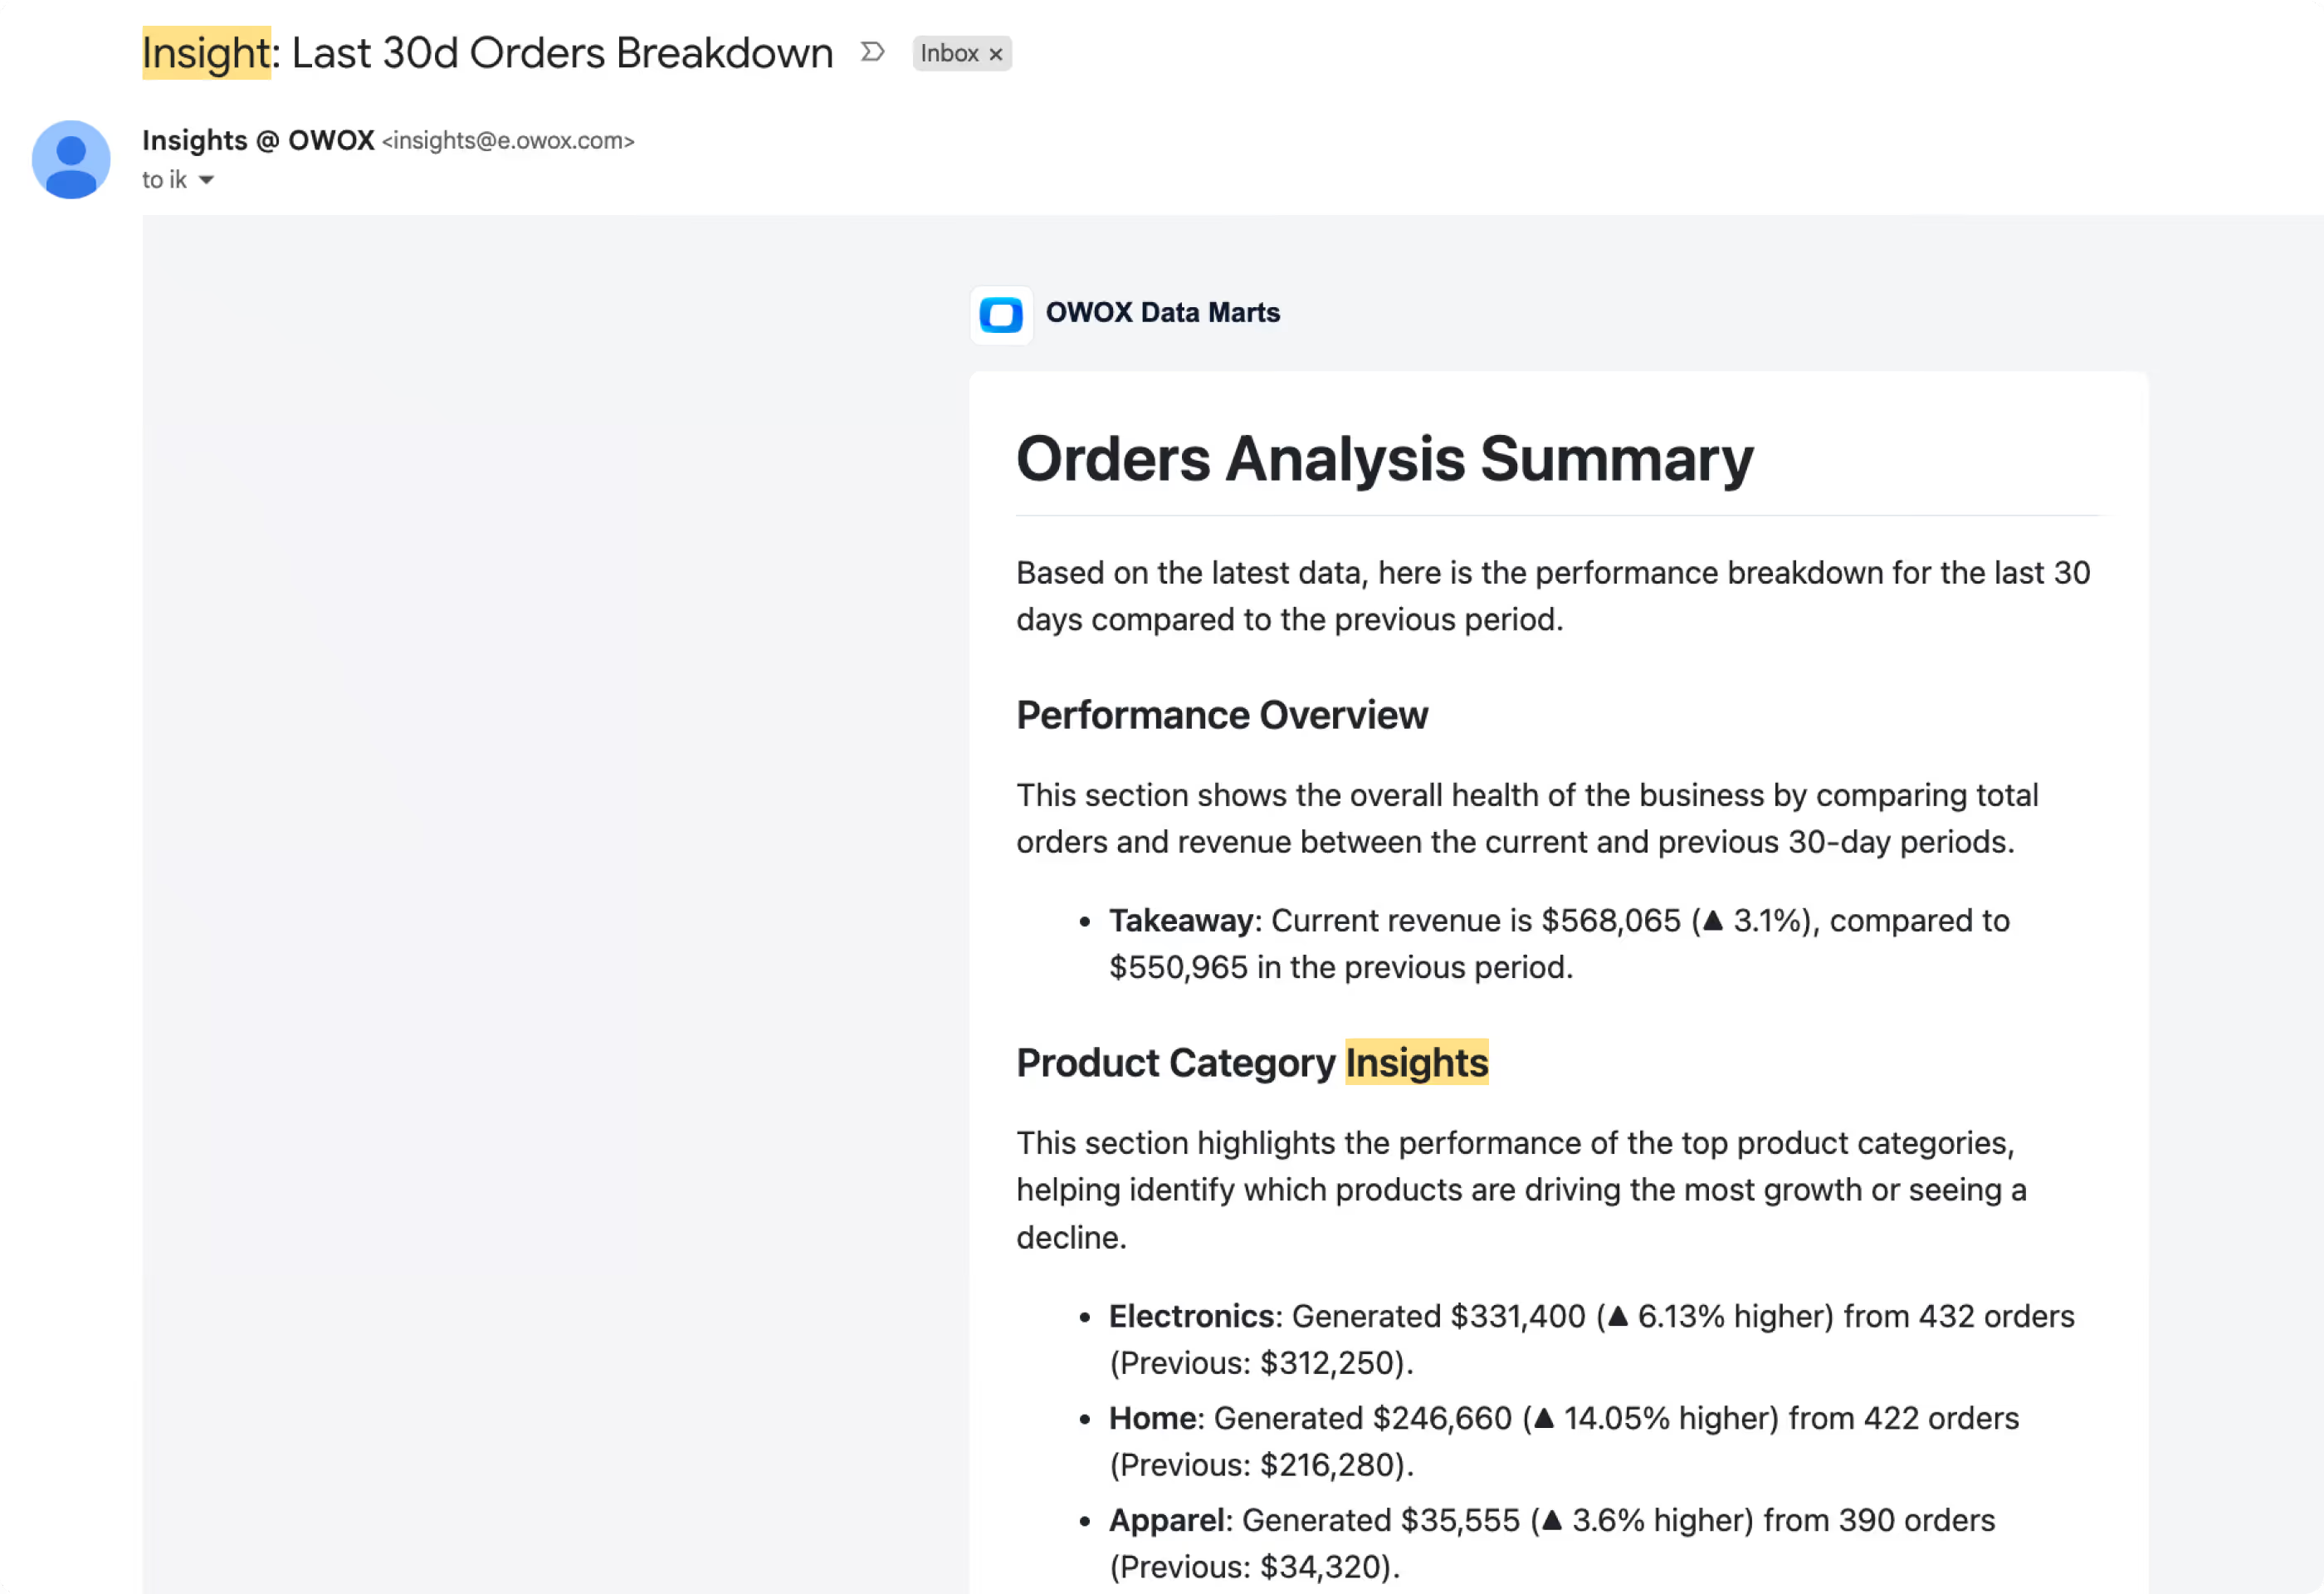
Insights turn Data Mart output into executive narratives delivered to Slack, Teams, or email. The CEO gets a Monday brief. Ops gets a daily recap. All deterministic.
The economics
A reporting analyst costs $70–120k a year. Most of the role is automatable.
We analyzed 1,438 job postings for reporting data analysts. Here's what companies pay six figures for — and what a Reporting Analyst handles out of the box.
| The skill on the job posting | ~% of listings | OWOX handles it |
|---|---|---|
| Writing & maintaining SQL | ~95% | Reusable, version-controlled Data Marts |
| Integrating data from sources | ~85% | Open-source connectors, zero data eng |
| Building & maintaining reports | ~80% | One Mart → Sheets, Looker, Slack, email |
| Scheduling & timely delivery | ~70% | Built-in scheduler — set once, runs forever |
| Enabling stakeholder self-service | ~65% | Mart library in Sheets — no tickets |
| Managing access & permissions | ~40% | Owners + context-based access per Mart |
What stays with your team — and gets more valuable: data integrity, business logic, metric definitions, and stakeholder translation. You're not replacing analysts. You're freeing the one you have.
What changes for your organization
Scale analytics without scaling headcount
When every team member has a Reporting Analyst, your analytics function transforms.

10× the analyst coverage
One analyst’s library serves the whole company. Every stakeholder self-serves 24/7 in Sheets — the queue disappears.

Numbers you can defend in a board meeting
Every cell traces back to analyst-approved SQL. Deterministic. Verifiable. No AI hallucinations — patented technology.

Data team works on strategy, not tickets
When the reporting backlog drops to zero, your analysts finally work on the problems you hired them to solve.
What users are saying
What data leaders say
Real things real customers said — each quote pinned to a specific claim, straight from the quotes database.
 Nodari RizunFounder & CEO, Pürblack®
“AI, by the nature of the models, will hallucinate. And because of that, you need something which will create guardrails to ensure that there are no hallucinations, that you can trust your data.”
Nodari RizunFounder & CEO, Pürblack®“OWOX removed the AI hallucinations from AI — and that's a huge problem, because AI by its nature will hallucinate. You need guardrails so you can trust your data.”
 Mark SimmonsCMO, Pürblack®
“There's an AI layer on top that develops the insights — but we know the data underneath is solid, so the risk of hallucination is much, much smaller.”
Customer stories
Teams that deployed self-service analytics
Organizations that scaled analytics without scaling headcount
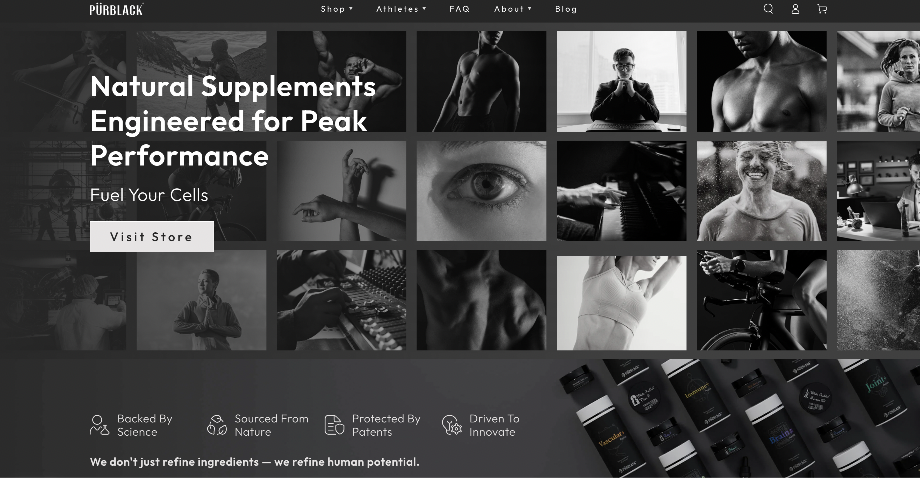 "For 10 years I was blind." The day Pürblack® founder stopped guessingSecondsto get reports across six channelsRead the story
  How OWOX Reports Helped Reformation Make Data-Backed DecisionsMinutesfrom data request to business decisionRead the story
  How OWOX Reports Streamlined Operations for WorkSimpli, Saving Over 10 Hours Weekly10hrs+saved per week on manual reportingRead the story
 F16 · A FREE TOOL FOR YOUR DATA TEAM
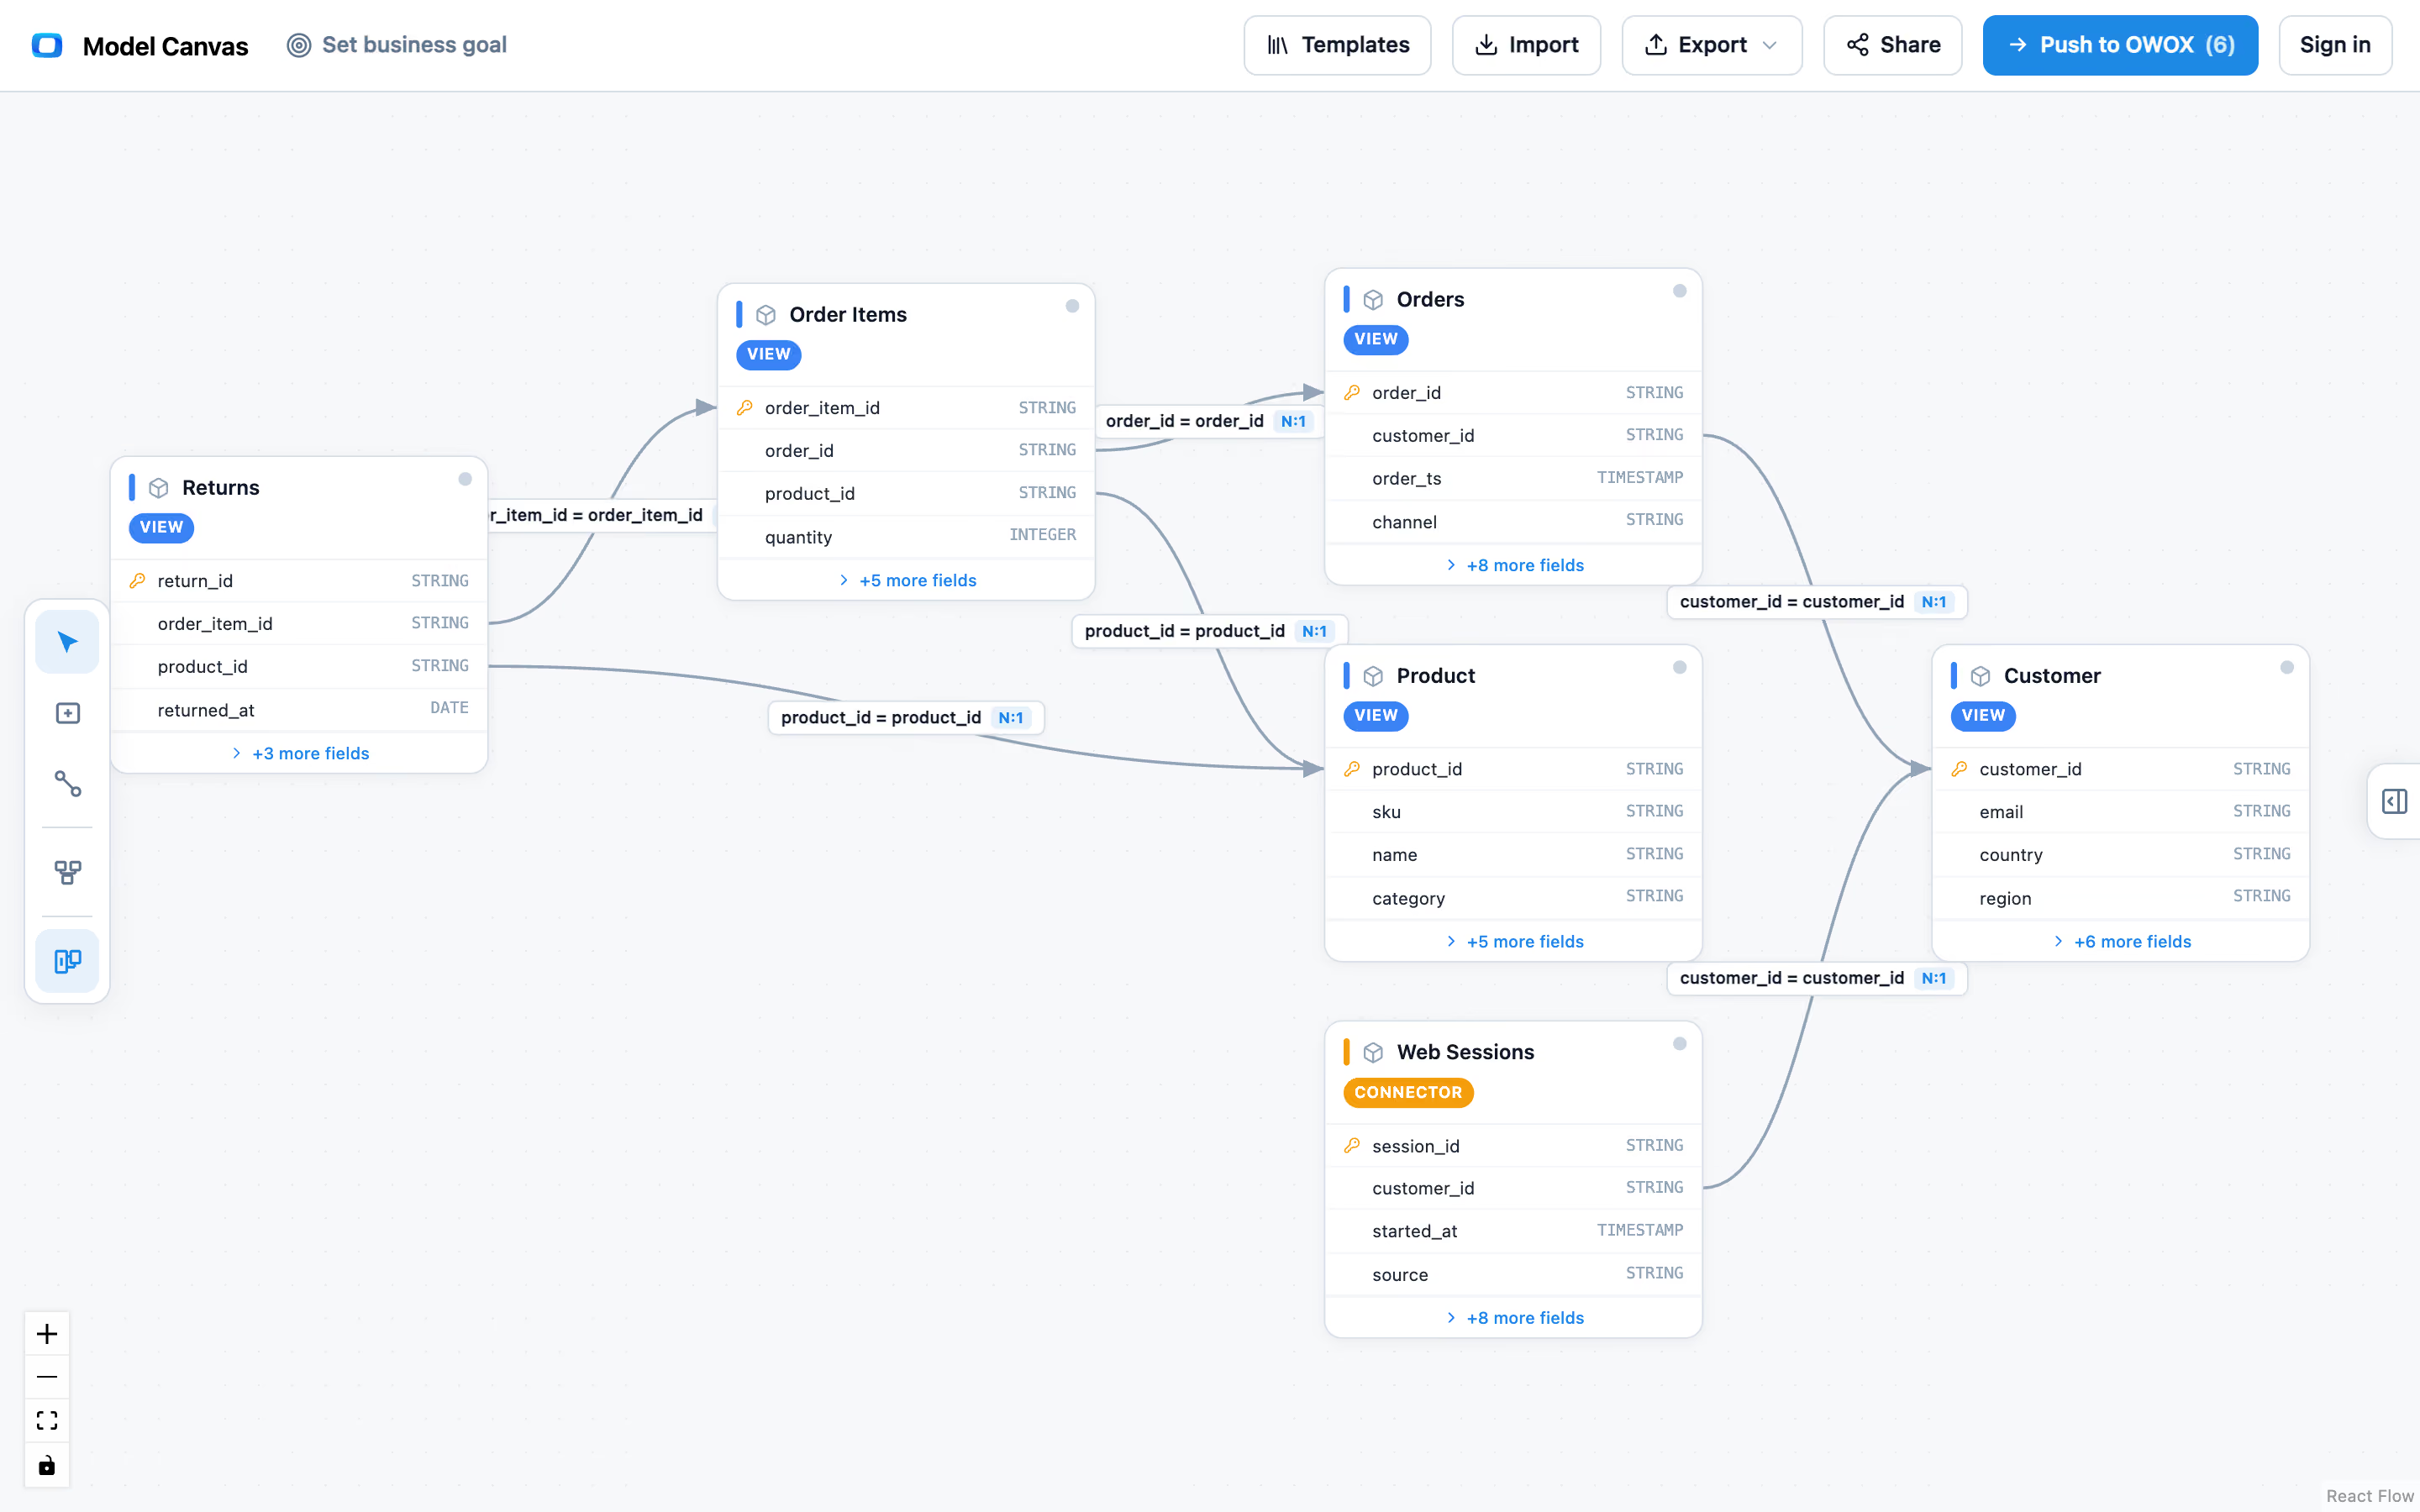
Model your domain before you build a mart — free, no login.
Model Canvas is a standalone visual data-modeling tool (open OKF format, pre-built domain models). Sketch Campaign → Spend → Revenue, share it with stakeholders, then bring it into OWOX when you're ready. It's a gift to your data team, not a pitch.
- Open OKF format — no vendor lock-in
- Pre-built domain models for SaaS, marketing, and finance
- Free forever, no login required
FAQ
Questions data leaders ask
How does this actually replace hiring another analyst?
Think about what a new analyst hire would do in their first 90 days: learn the warehouse, understand the metrics, build reports for 3–4 teams, then spend the rest of the year maintaining those reports and fielding “can you add one more column?” tickets. OWOX compresses that entire cycle. Your existing data team picks tables from the warehouse, one-click populates a governed Data Mart library, and publishes it. From that point on, every stakeholder opens Google Sheets, browses the library with the column picker, joins Data Marts by analyst-defined keys, picks the columns they need, and refreshes on schedule. You didn’t hire someone new. You made the person you already have 10× more effective.
How can I trust the numbers if AI is involved?
This is the question that matters most. When your CMO asks ChatGPT “what’s our ROAS by channel?”, the LLM generates a SQL query on the fly — and that query might be different every time, might join wrong tables, might hallucinate a column that doesn’t exist. Nobody catches it until the wrong number shows up in a board deck. OWOX works the opposite way. Your analyst writes the SQL, approves the logic, and publishes it as a Data Mart. When a stakeholder pulls data through the column picker, they’re picking columns from that pre-approved schema — the query is deterministic, identical every time. AI Insights work the same way: the analyst defines SQL templates with data placeholders, AI writes the narrative prose around the numbers, but the numbers themselves are the result of those deterministic queries. Patented technology. Every cell is traceable.
We have 6 teams that all define “revenue” differently. How does OWOX fix that?
This is the exact problem the Data Mart library solves. Your data team defines “revenue” once — as a Data Mart with a clear SQL definition, a business-friendly alias, a description of what it includes and excludes, and an assigned Business Owner. That single Data Mart gets published to the library. When marketing, sales, finance, ops, product, and leadership pull revenue data in Google Sheets, they all pull from the same Data Mart. Same definition. Same numbers. The reconciliation problem disappears because you eliminated the root cause: multiple definitions.
How long until my teams are actually using this?
The first Data Mart takes minutes — connect your warehouse, pick a table, OWOX auto-generates the governance layer. A useful initial library covering your top 10–15 most-requested metrics can be built in a few days. Stakeholders see the library in Google Sheets immediately after publishing — there’s no training period because the interface is a column picker inside the spreadsheet they already live in. This isn’t a six-month semantic-layer implementation. Your data team builds incrementally: start with the metrics that generate the most tickets, publish those first, watch the queue shrink, then expand.
What does this cost compared to hiring another analyst?
An analyst costs $80–120K/year fully loaded, takes 3 months to ramp, and serves maybe 3–4 teams before becoming a bottleneck again. OWOX is free to start — 30 credits, no credit card. The Reporting Analyst tier is from $65/month. Team plans — which include AI Insights, multi-destination delivery (Sheets, Slack, Teams, email), multiple projects, and SLA — start at $875/month. That's roughly 1% of an analyst salary for a system that scales to every team in the company. Enterprise pricing is custom. The self-managed edition is free forever on your own infrastructure.
Can I self-host for data residency or compliance?
Yes — and this matters more than most analytics vendors acknowledge. OWOX Data Marts can run entirely on your infrastructure: GCP, AWS, Azure, DigitalOcean, Render, or a local machine. The platform code is ELv2-licensed (free for internal use and client work), connectors are MIT. Your data never touches OWOX servers. For teams that need Cloud convenience but still want control, the Cloud edition also keeps data in your warehouse — OWOX queries it, never replicates it. Enterprise features like SSO (SAML), granular access permissions, and monitoring require a separate license. Six deployment paths, zero lock-in.
What's the difference between the Reporting Analyst and the Senior Analyst?
The Reporting Analyst builds the governed library and lets every team self-serve reports in Sheets — it's how you kill the reporting queue. The Senior Analyst sits on top: your stakeholders ask questions in plain language (@owox in Slack, Claude, or ChatGPT) and get trusted, traceable answers — never hallucinated. Most teams start with the Reporting Analyst and add the Senior Analyst when "can you pull this?" turns into "why did this happen?"