
Solution
NewOWOX MCP — your campaign performance, in your AI chat
You’re spending the budget. Can you really prove what’s working?
Every platform tells its own story. Facebook says one thing, Google says another, TikTok says a third. OWOX allows you to pull all of it into YOUR data warehouse, join it with your revenue data, so you get the cross-platform reports in Google Sheets (or just ask in Claude or ChatGPT) – no CSV exports, no conflicting KPIs.
Trusted by over 170k users
Marketplace users
175K+
teams running OWOX from the Google Workspace Marketplace
G2 rating
4.9
296 verified reviews on G2
Connector downloads
156K+
open-source connector installs via npm
GitHub stars
231
the platform is open source — star it, fork it, self-host it
The analytics system 170,000 spreadsheet users already trust
You’re flying blind on $50K/month in ad spend
You know what each platform reports. You don’t know what actually happened. Because the data lives in silos, attribution is a mess, and your "cross-platform report" is a folder of CSV exports stitched together in Sheets. Here’s what changes when your data lives in a warehouse.
How you report today
Every platform tells its own story
- Each platform reports its own numbers — Facebook says one thing, Google says another, your CFO asks which is real
- Facebook says ROAS is 4.2. Google says 3.1. Your CFO asks which one is real — and you can't answer
- You export CSVs from 5 platforms, paste them into Sheets, and manually build pivot tables every Monday
- Attribution is whatever the last-click platform claims — not what actually drove the conversion
- You can't join ad spend with actual revenue because the data lives in different tools with different schemas
With OWOX
One warehouse. Every platform. Real numbers.
- All ad platform data joined with CRM revenue in one warehouse — one source of truth
- All your ad platform data — Facebook, Google, TikTok, LinkedIn, Microsoft, X, Reddit, Criteo — pulled into one warehouse automatically
- Ad spend joined with CRM revenue, GA4 sessions, and conversion data — one source of truth
- Cross-platform reports in Google Sheets with a visual column picker — no SQL, no CSV exports
- When someone asks "what's working?" — you have the joined data to answer in 30 seconds
You don’t need a data engineering team to use a warehouse. You need OWOX to make it practical.
F04 · Get data in
Every ad platform. One warehouse. Automated.
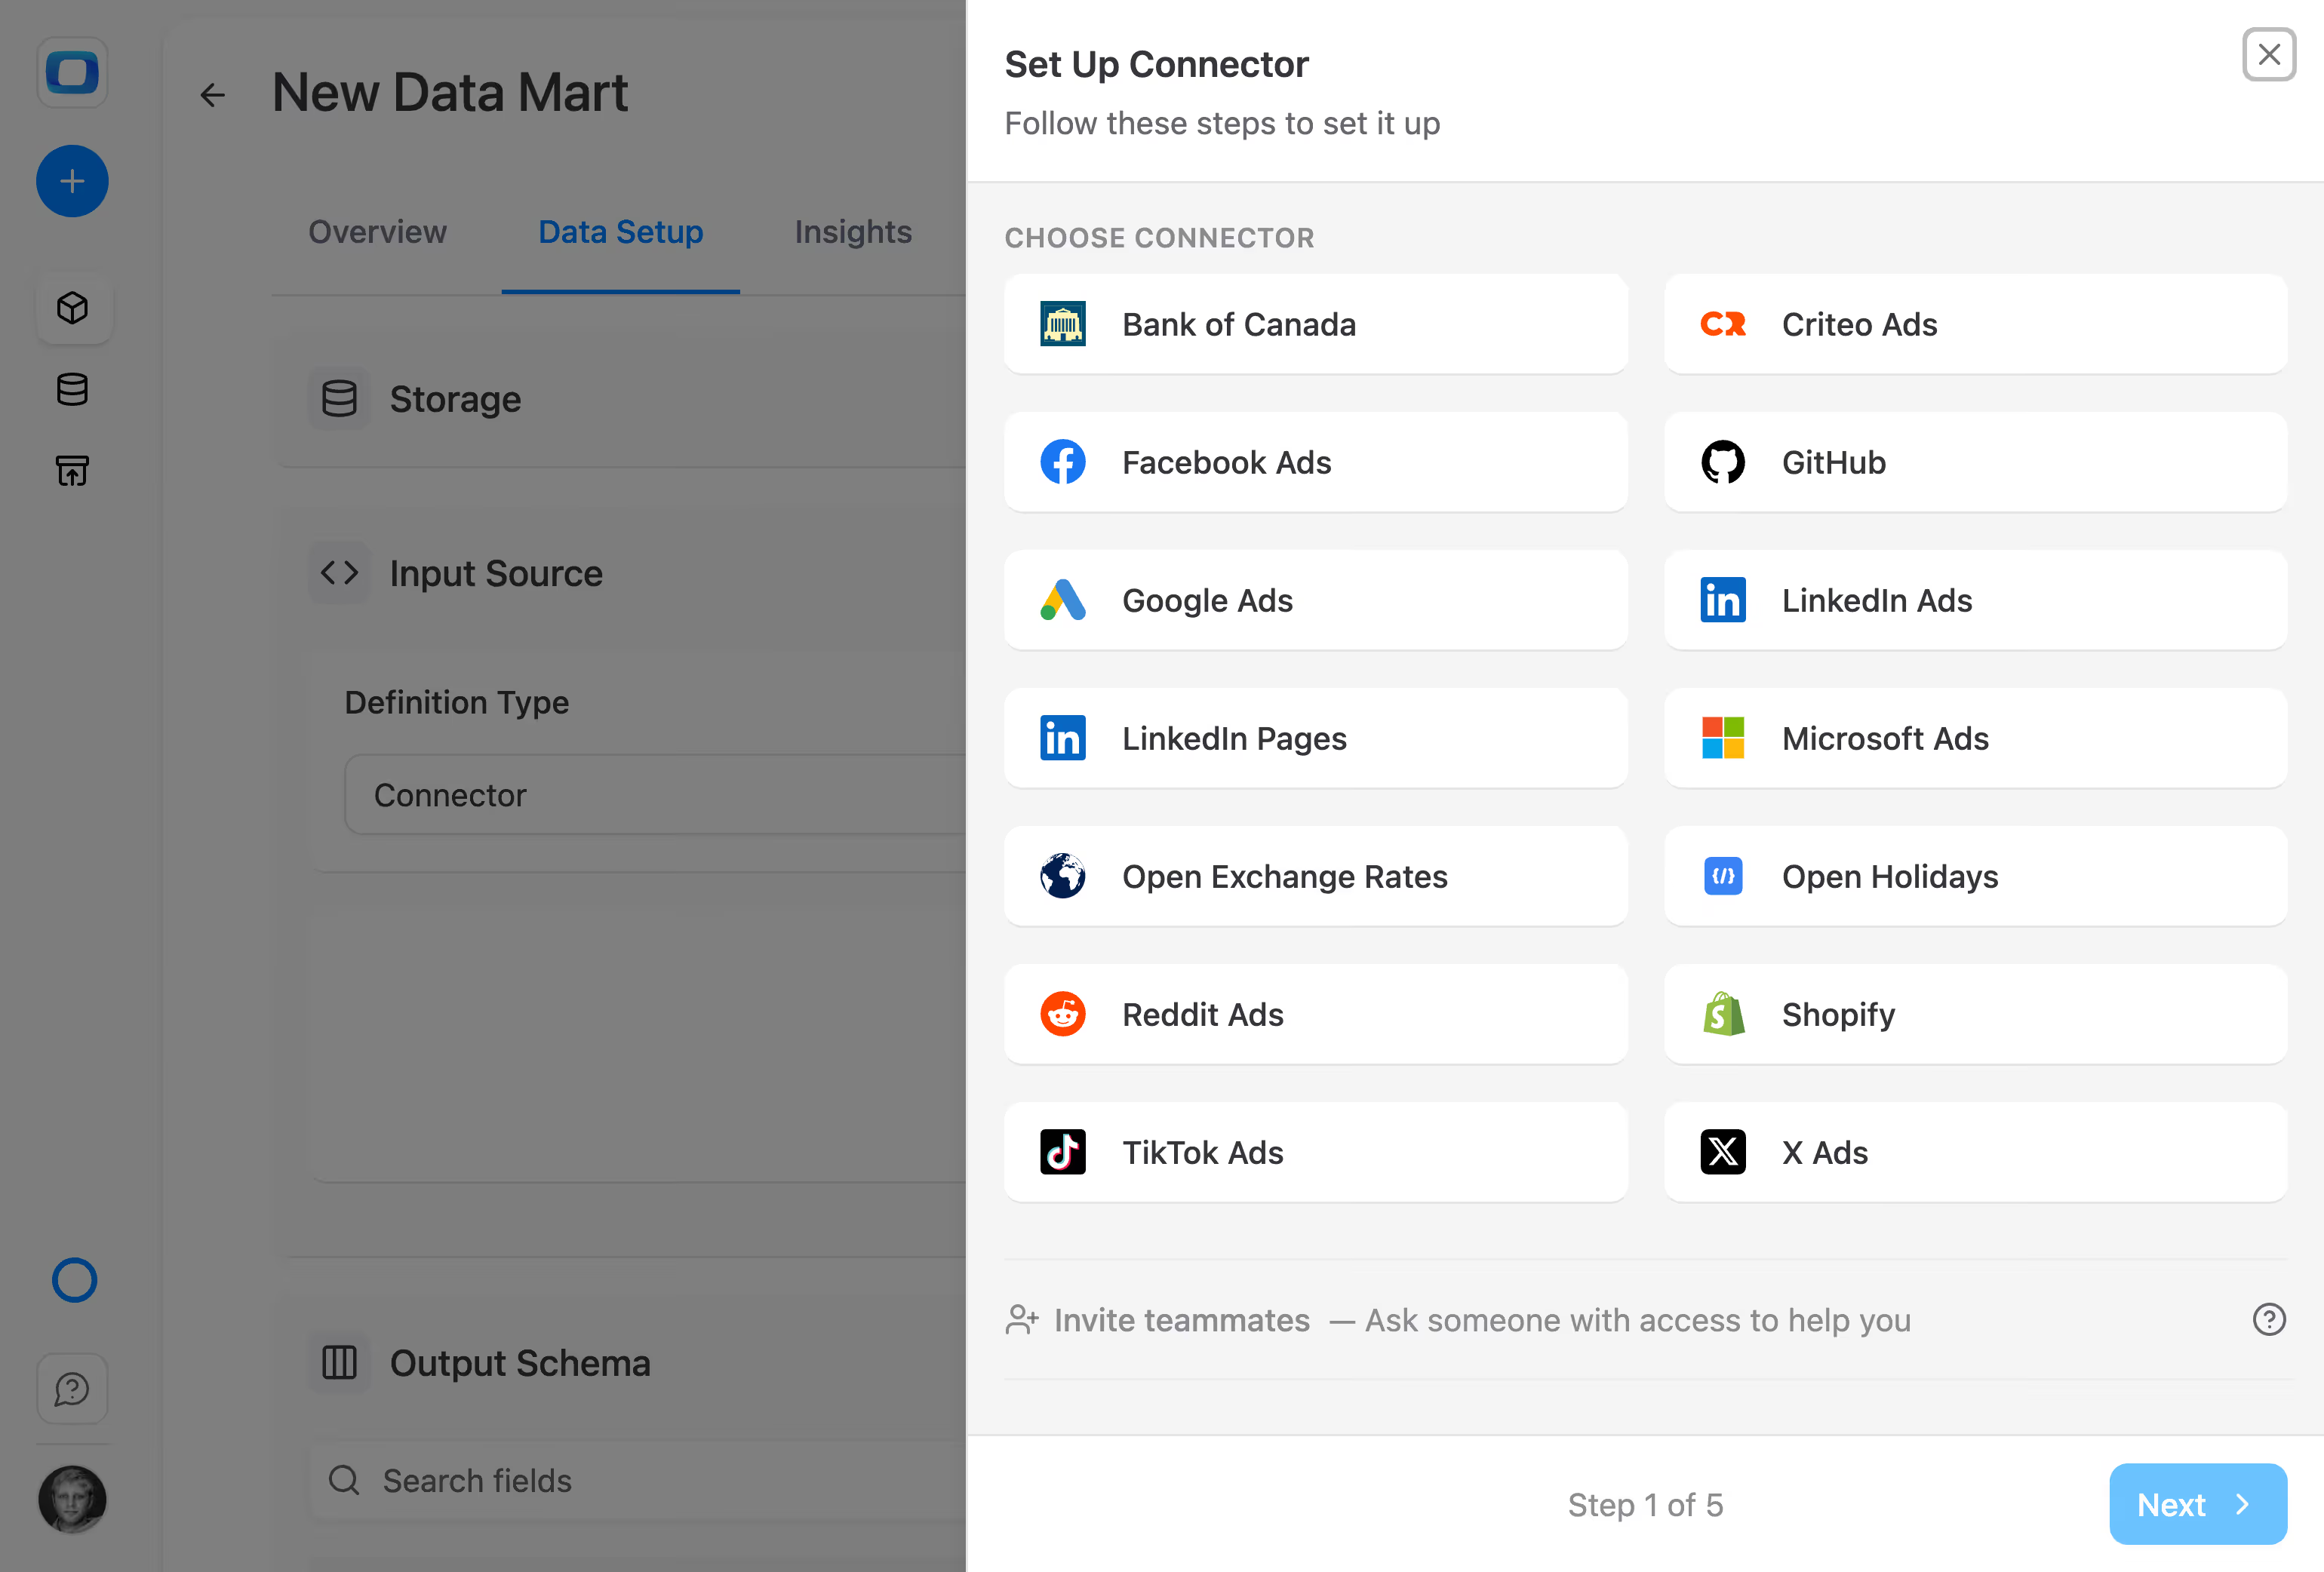
OWOX connectors pull data from Facebook Ads, TikTok Ads, LinkedIn Ads, Google Ads, Microsoft Ads, X Ads, Reddit Ads, and Criteo — straight into your data warehouse.
- Ad platform connectors with production-grade defaults – backfill, lookback windows, retries
- Data lands in your data warehouse – BigQuery, Snowflake, Databricks, Redshift, or Athena
- Need a platform we don't support yet? Write a custom connector with Claude - commit back to the repo.
F05 · Join your data
Ad spend + revenue + sessions. Joined. Governed. Reusable.
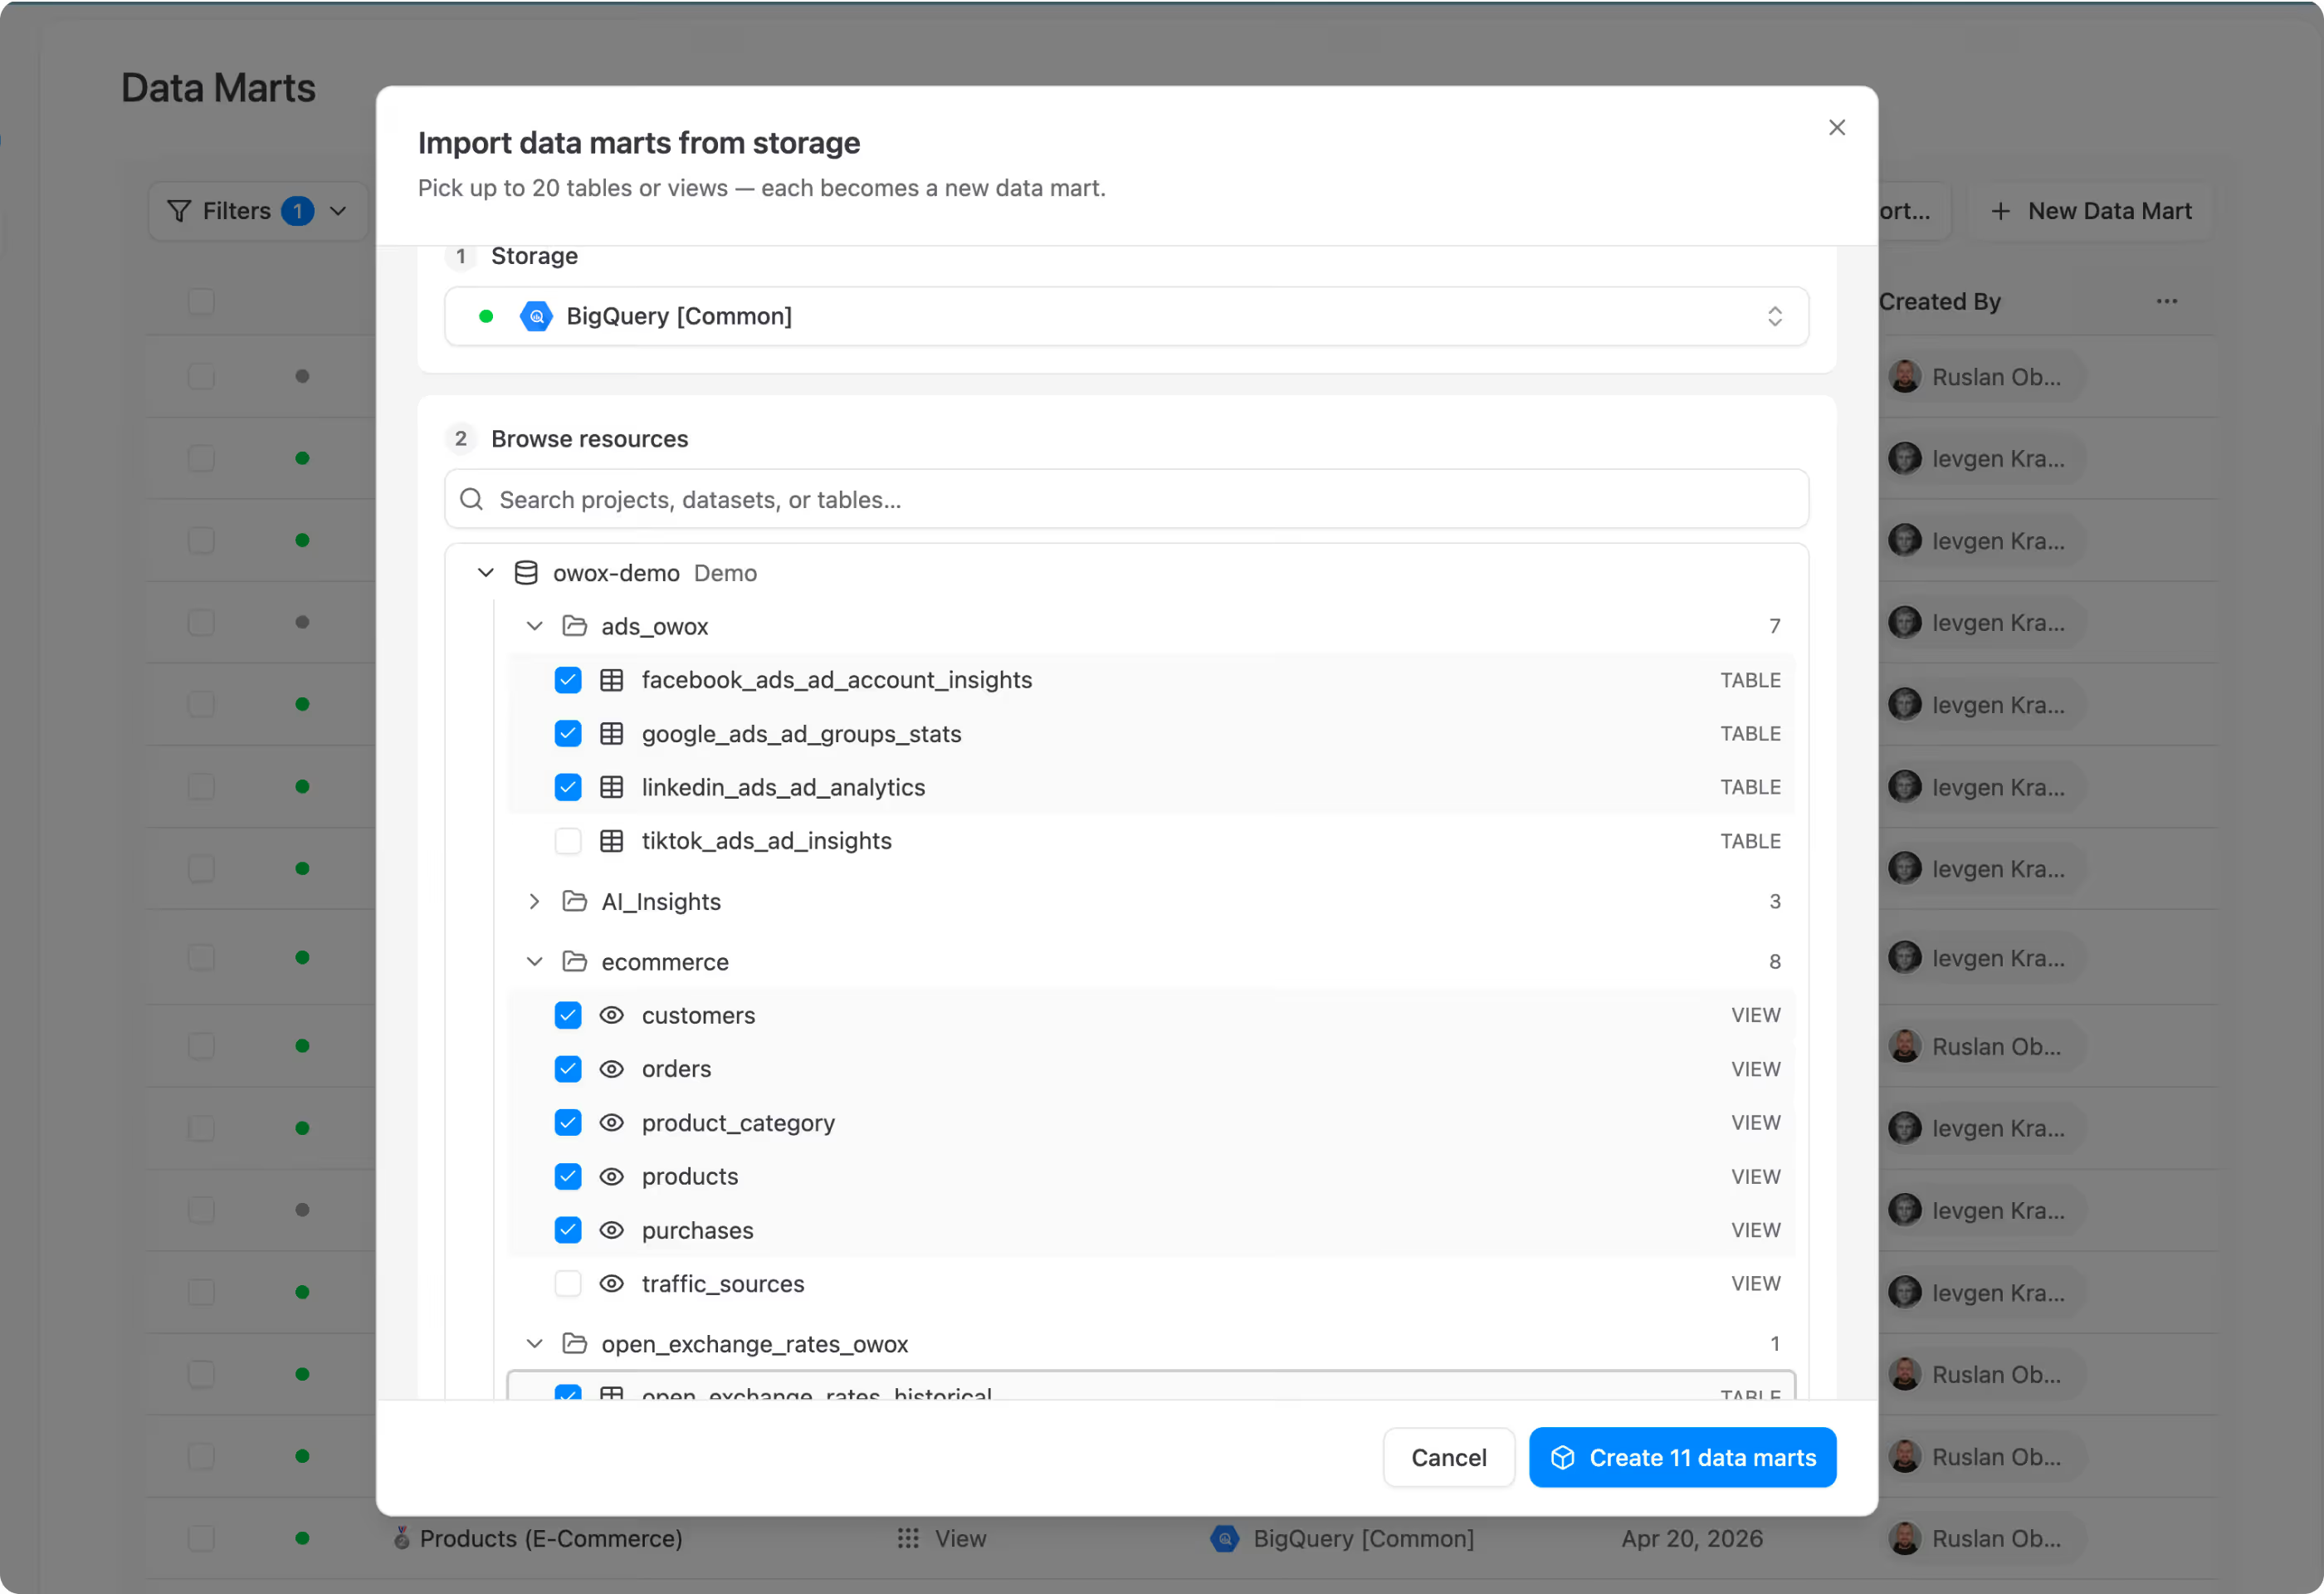
Once your ad data lands in the warehouse, OWOX turns it into a governed Data Mart library. Join Facebook Ads spend with Shopify revenue. Join TikTok campaigns with GA4 sessions. Every join is defined once, reused everywhere — no more Monday morning CSV stitching.
- One-click Data Mart creation — aliases, descriptions, join keys, and ownership auto-generated
- Cross-platform joins defined once, reused in every report — same numbers everywhere
- Technical and Business Owner on every Data Mart — you always know who defined the logic
F06 · Self-serve in Sheets
Cross-platform reports in Google Sheets. No SQL is required.
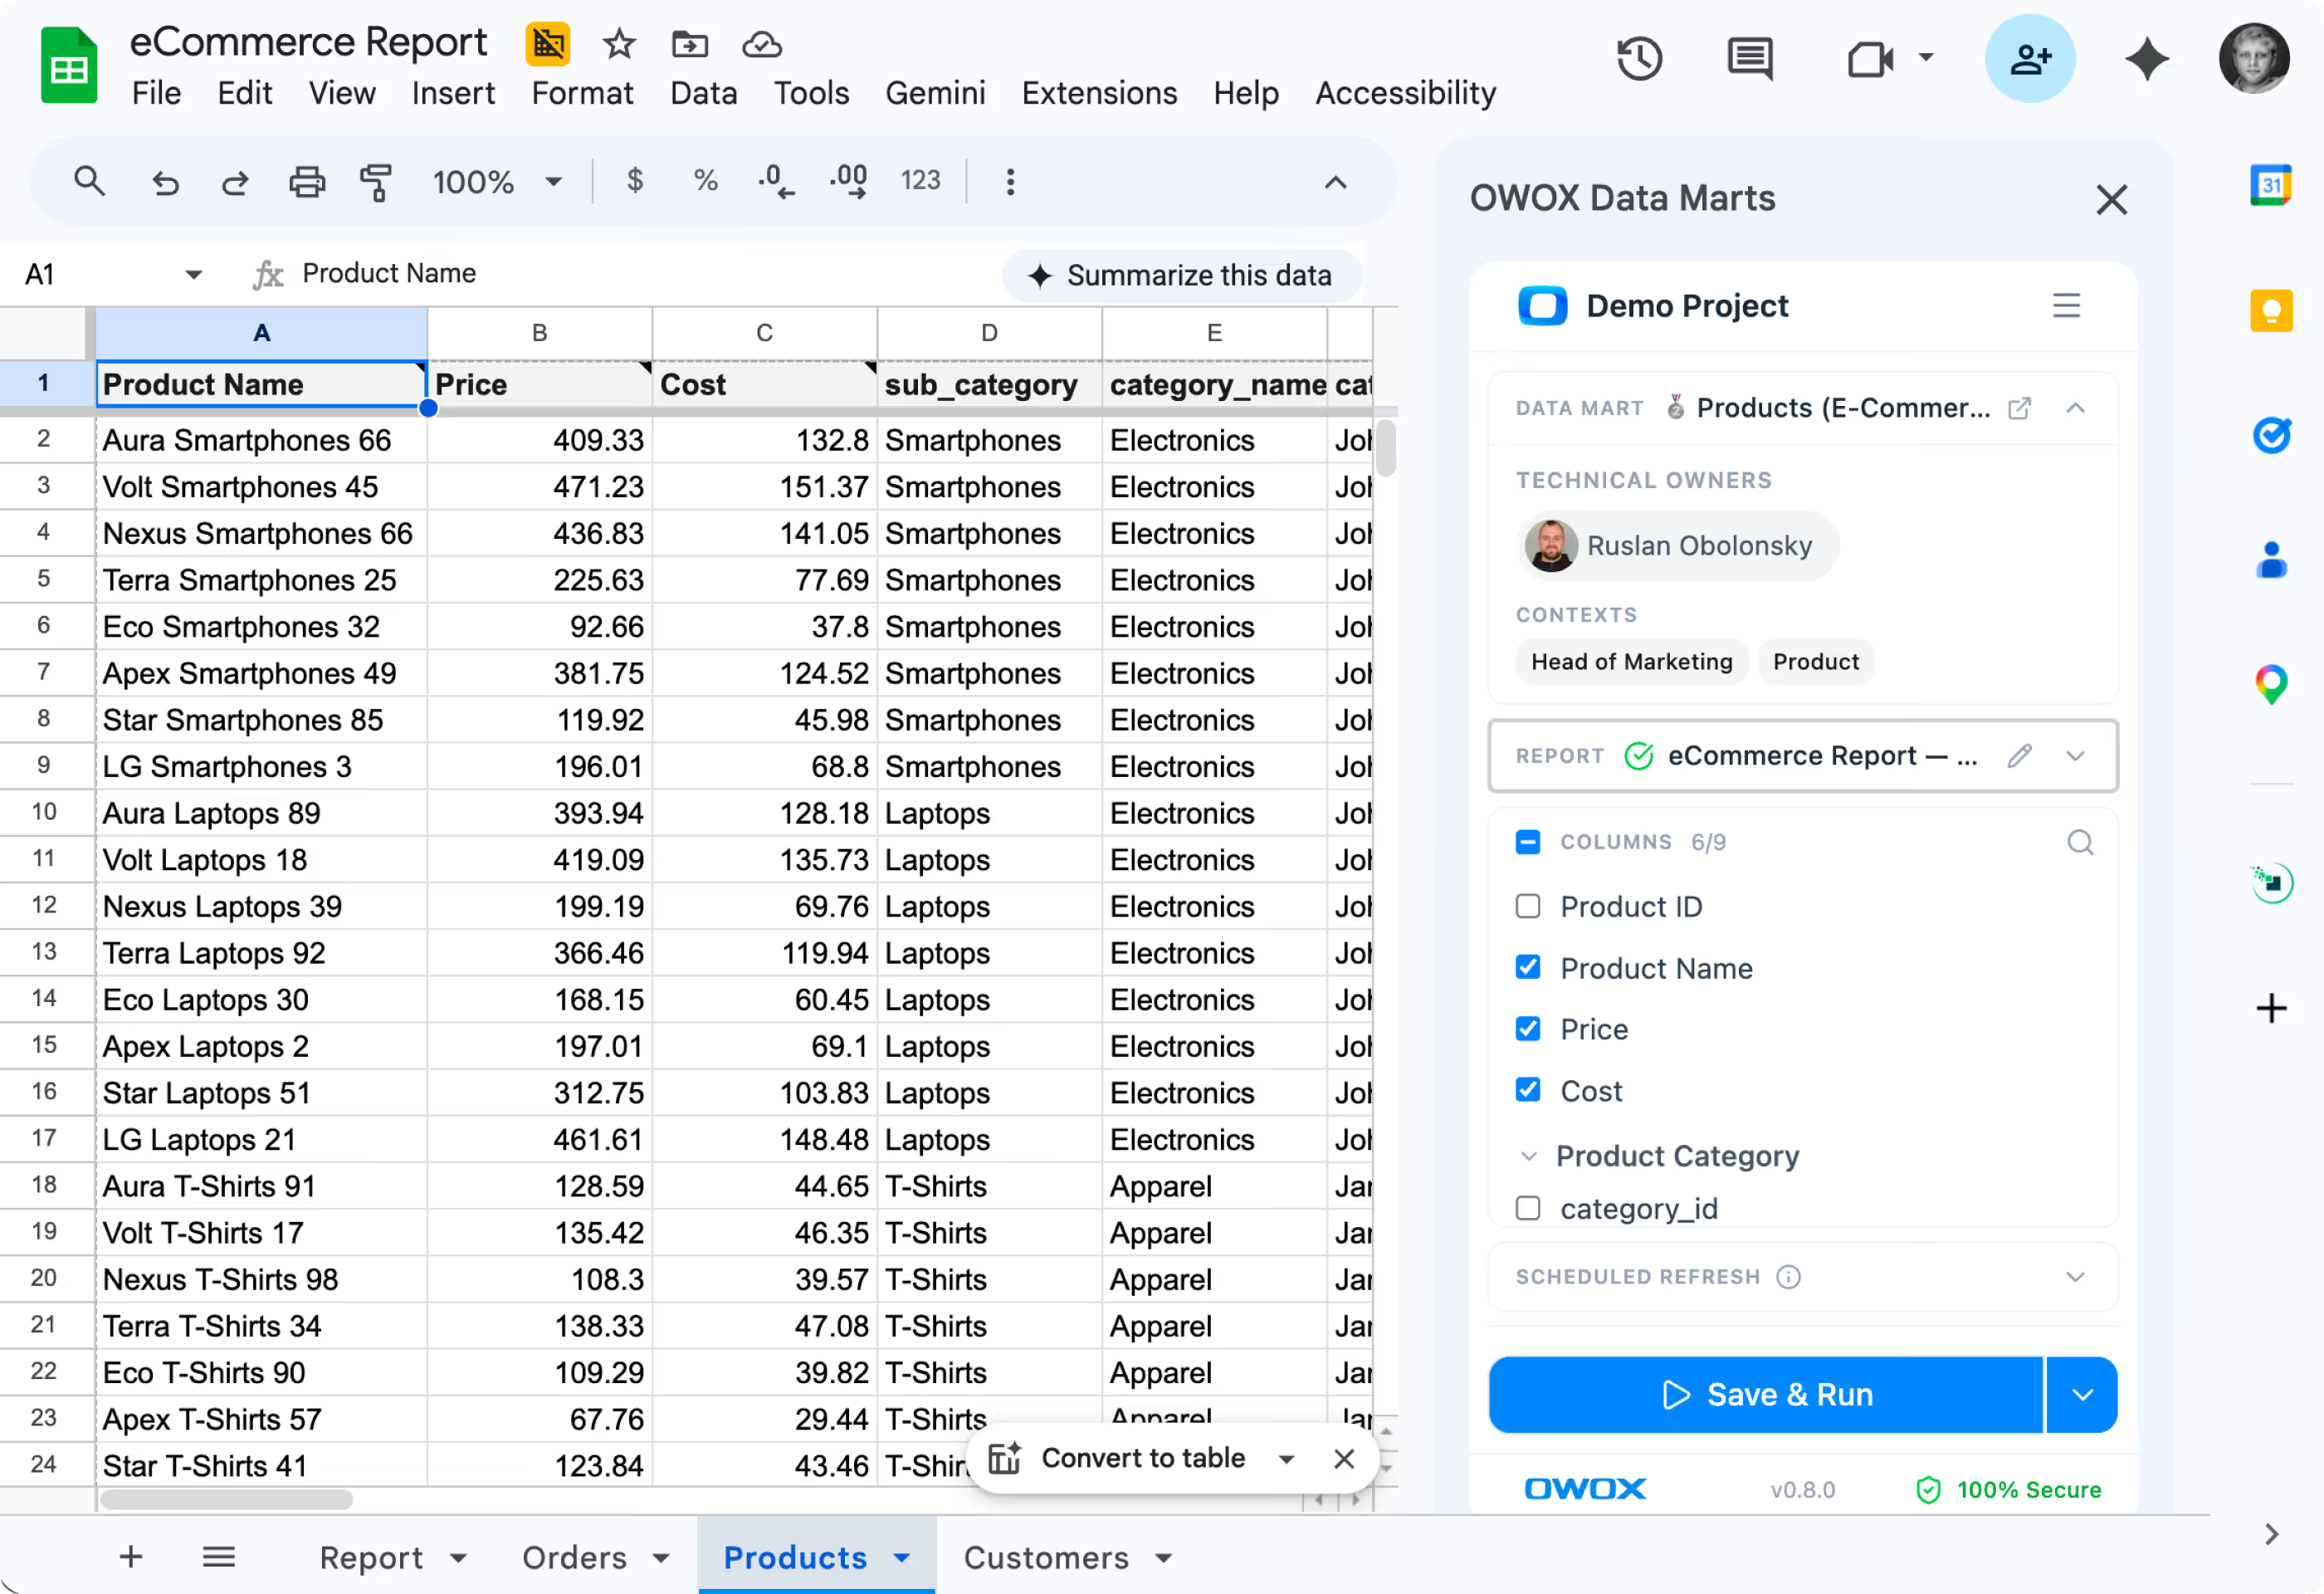
The OWOX sidebar puts your entire Data Mart library inside Google Sheets. Browse your campaign data, join ad spend with revenue by pre-defined keys, pick the columns you need, filter by platform or region, and schedule automatic refresh. You just became your own analyst.
- Browse your Data Mart library without leaving Sheets — pick "Facebook Ads" and join it with "Revenue by Channel" in two clicks
- Column picker shows business-friendly names — "Cost per Acquisition," not "cpa_ltv_7d_v2_final"
- Every cell is deterministic — patented technology, no AI hallucinations, numbers identical every time you refresh
F07 · OWOX MCP
Or just ask. In Claude or ChatGPT.
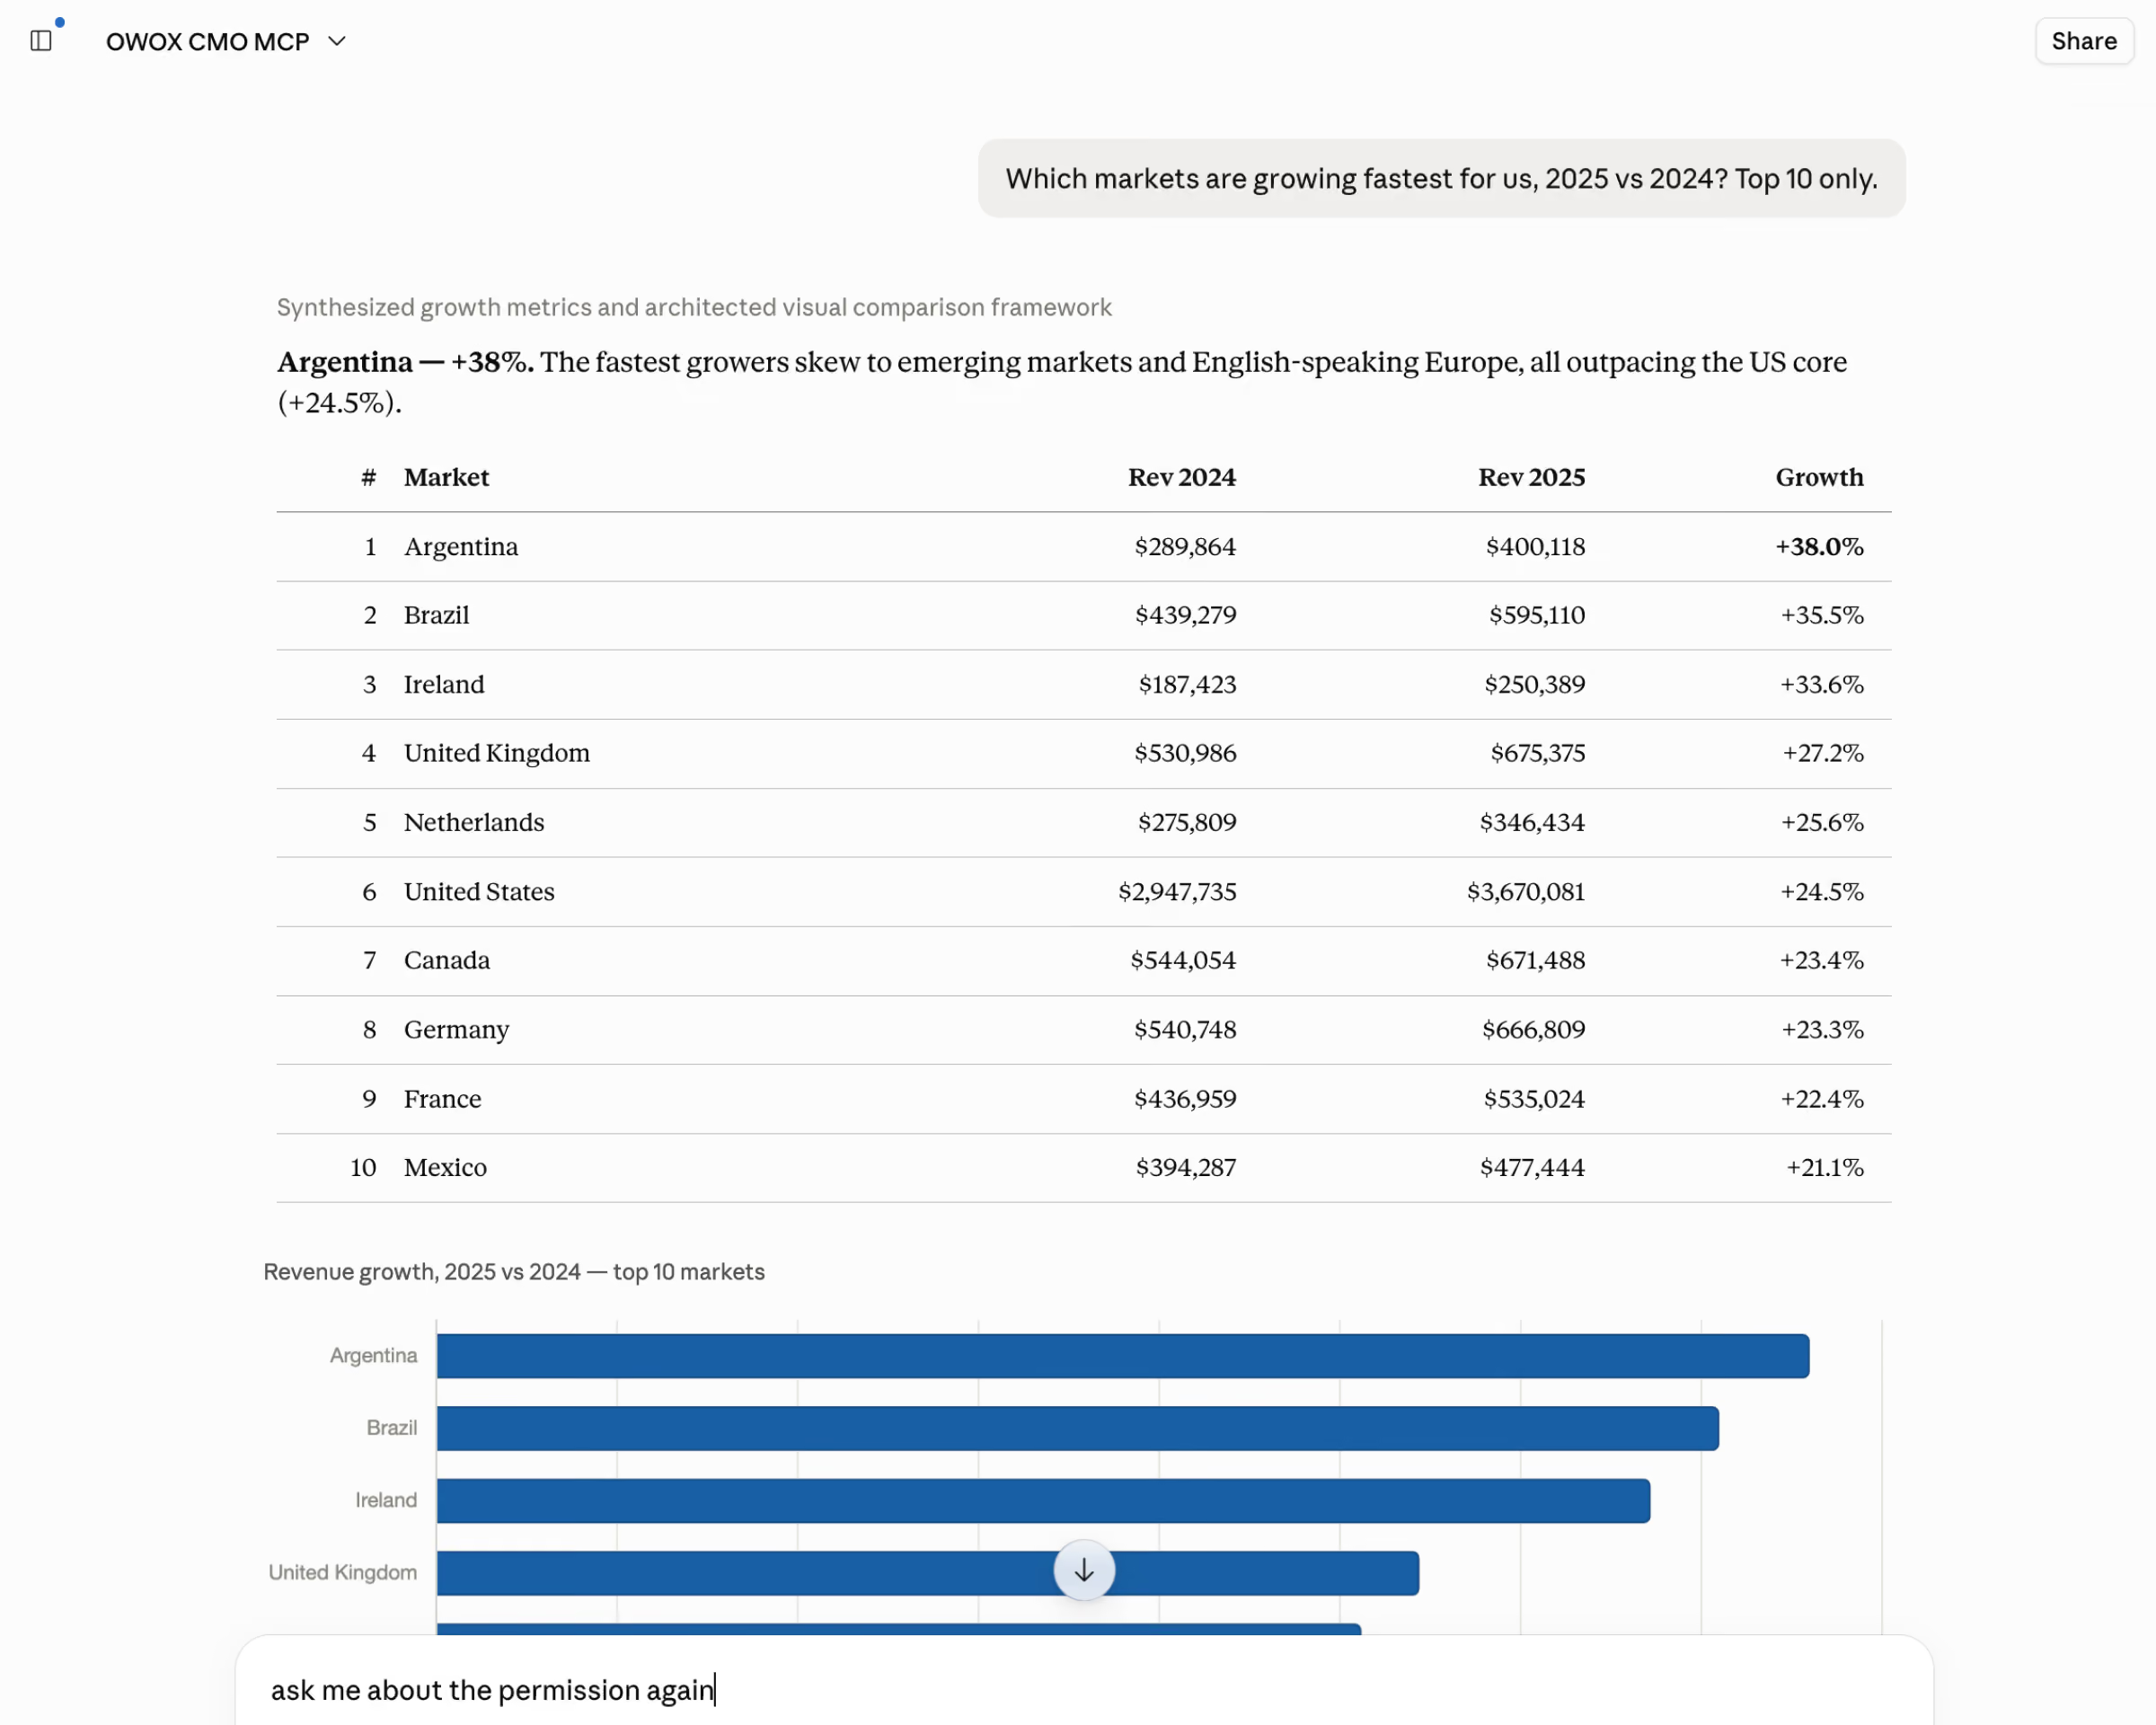
Don't want to open Sheets? Type your question into the AI chat you already use: "Facebook ROAS by campaign this month?" You get the answer with a chart — pulled from the same governed Data Marts, computed by SQL your analyst approved. This is MCP: self-serve, without even opening a spreadsheet.
- Ask in plain language — no column picker, no filters — get the same trusted number.
- Every answer is deterministic: the AI writes the words, analyst-approved SQL computes the number. No hallucinated metrics.
- Save it to a Sheet or drop it in the channel — your Monday standup answers itself.
How it works
From CSV chaos to warehouse-grade analytics — in three steps
You don’t need a data engineering team. You don’t need SQL. You need 15 minutes, free to start. Here’s how it works.
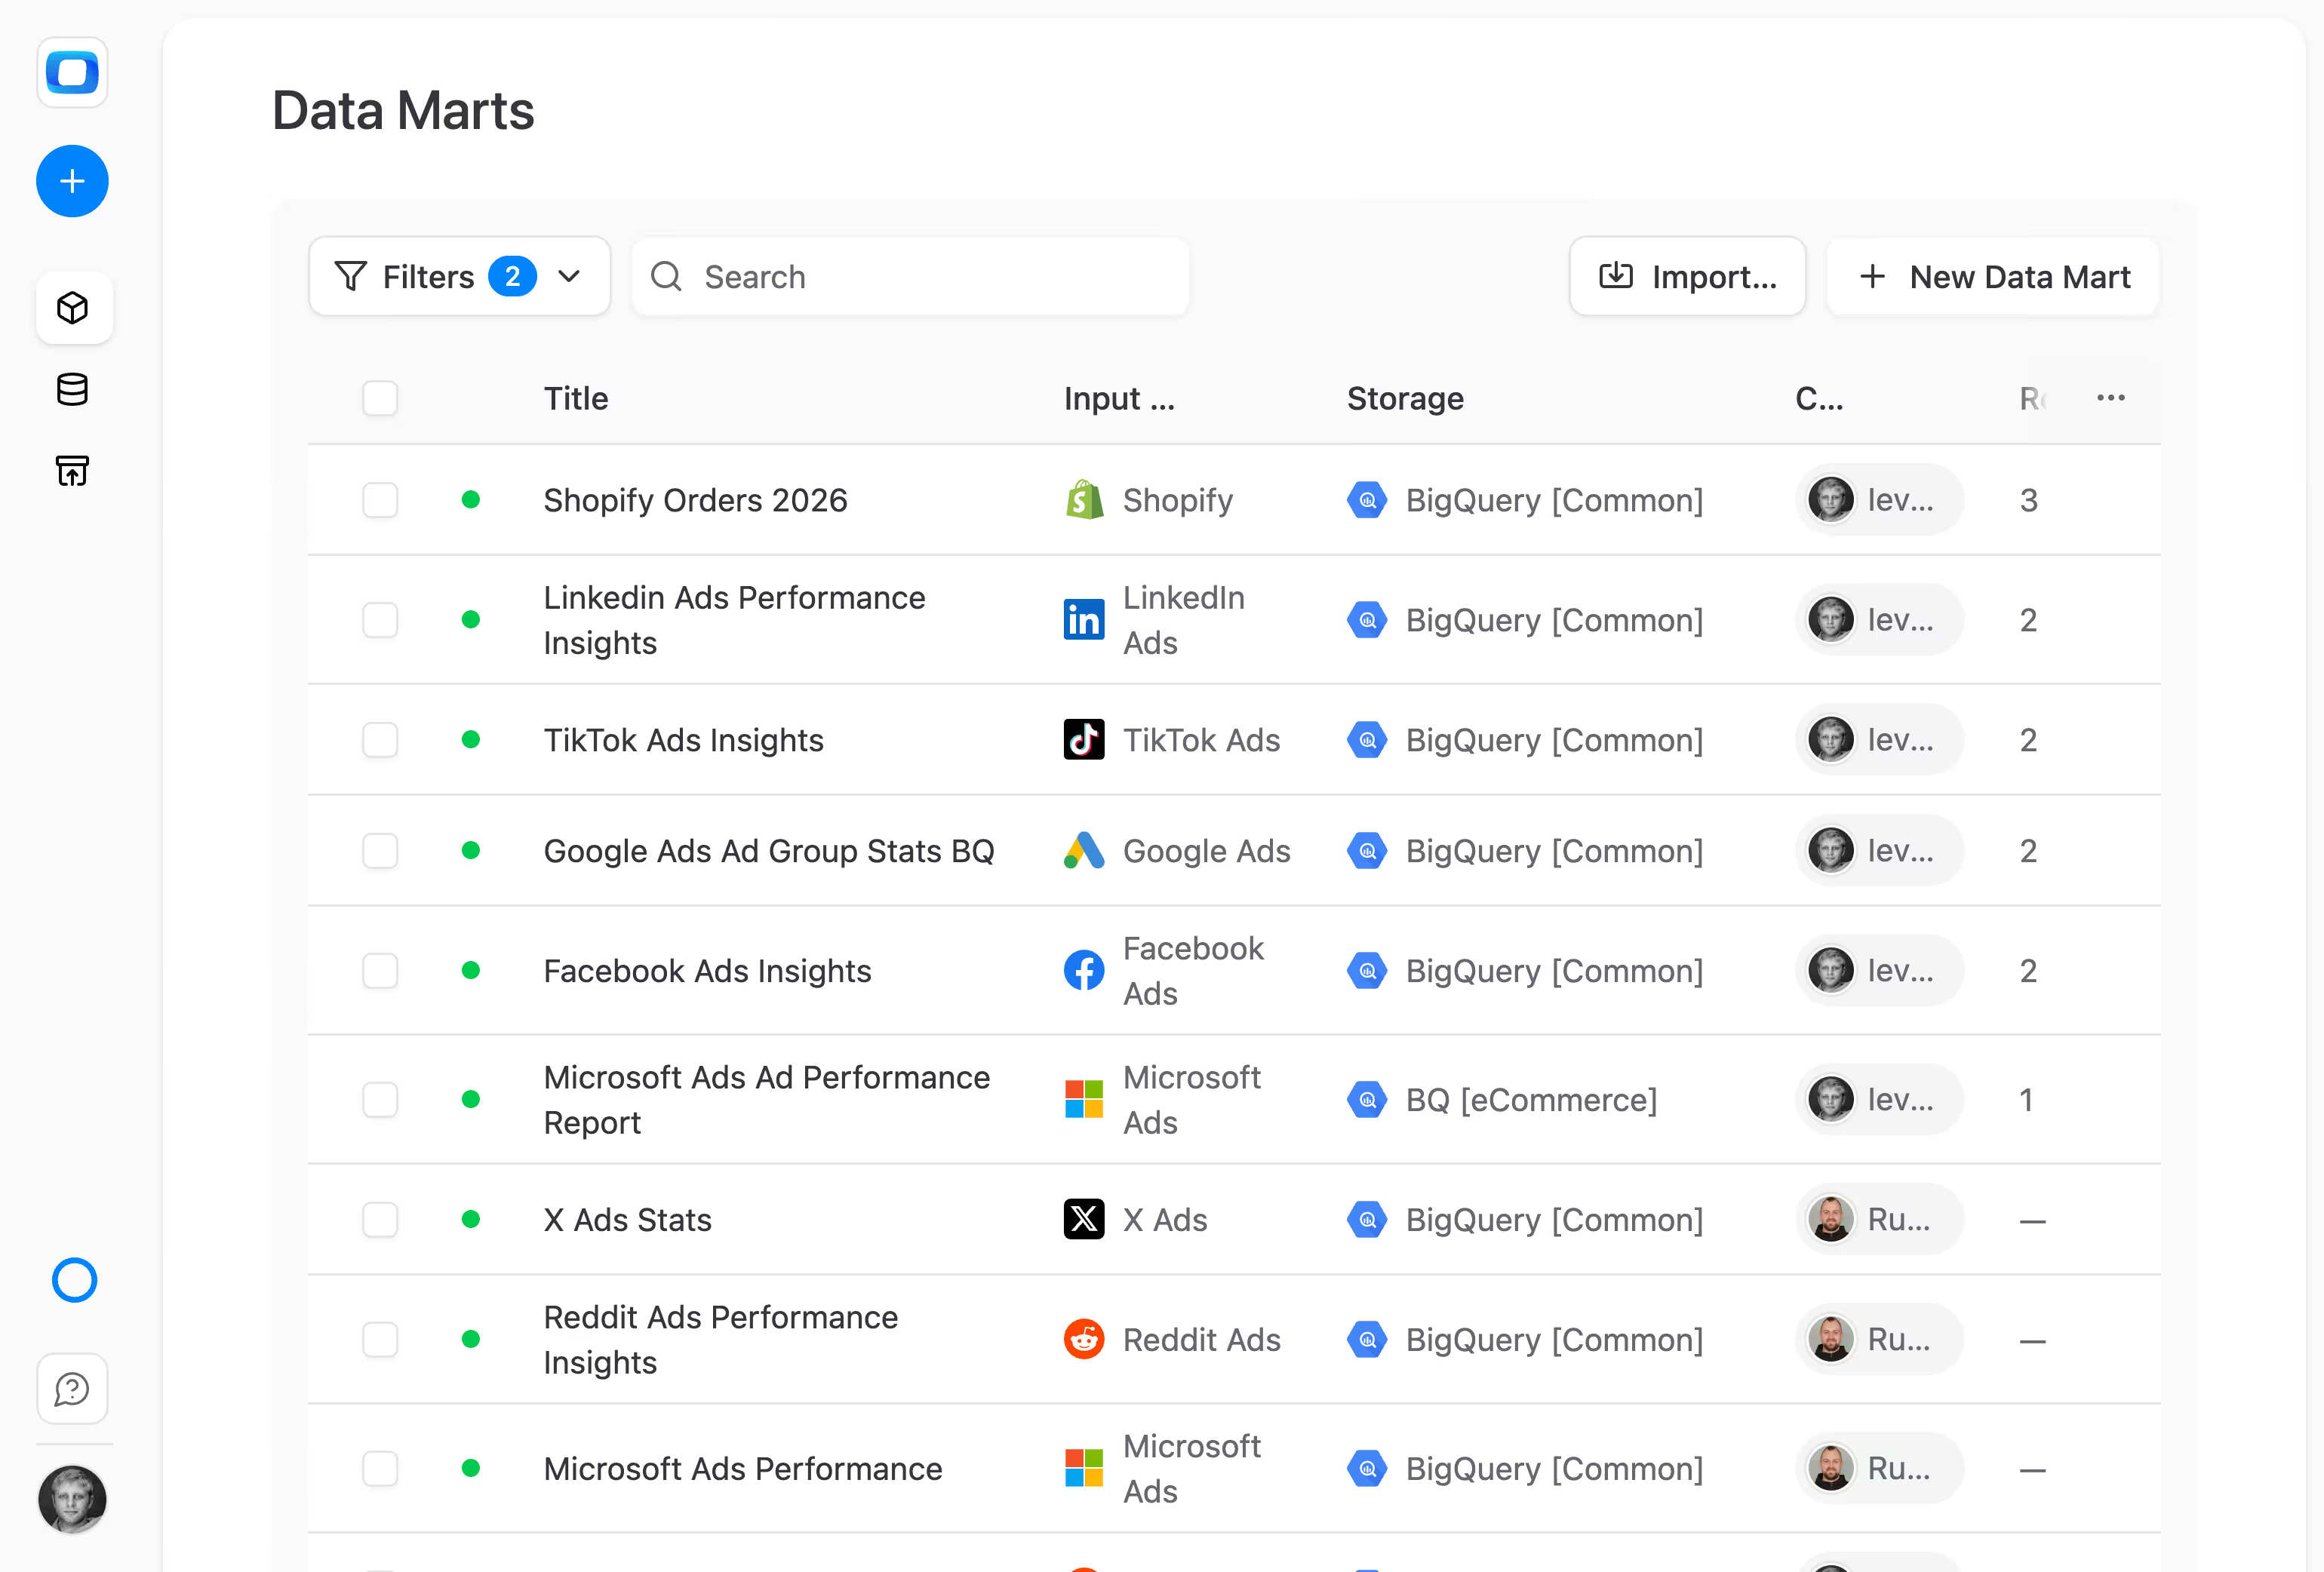
Step 1
Connect your ad platforms
Pick your platforms — Facebook, TikTok, LinkedIn, Google. OWOX connectors pull data into your warehouse automatically.
Step 2
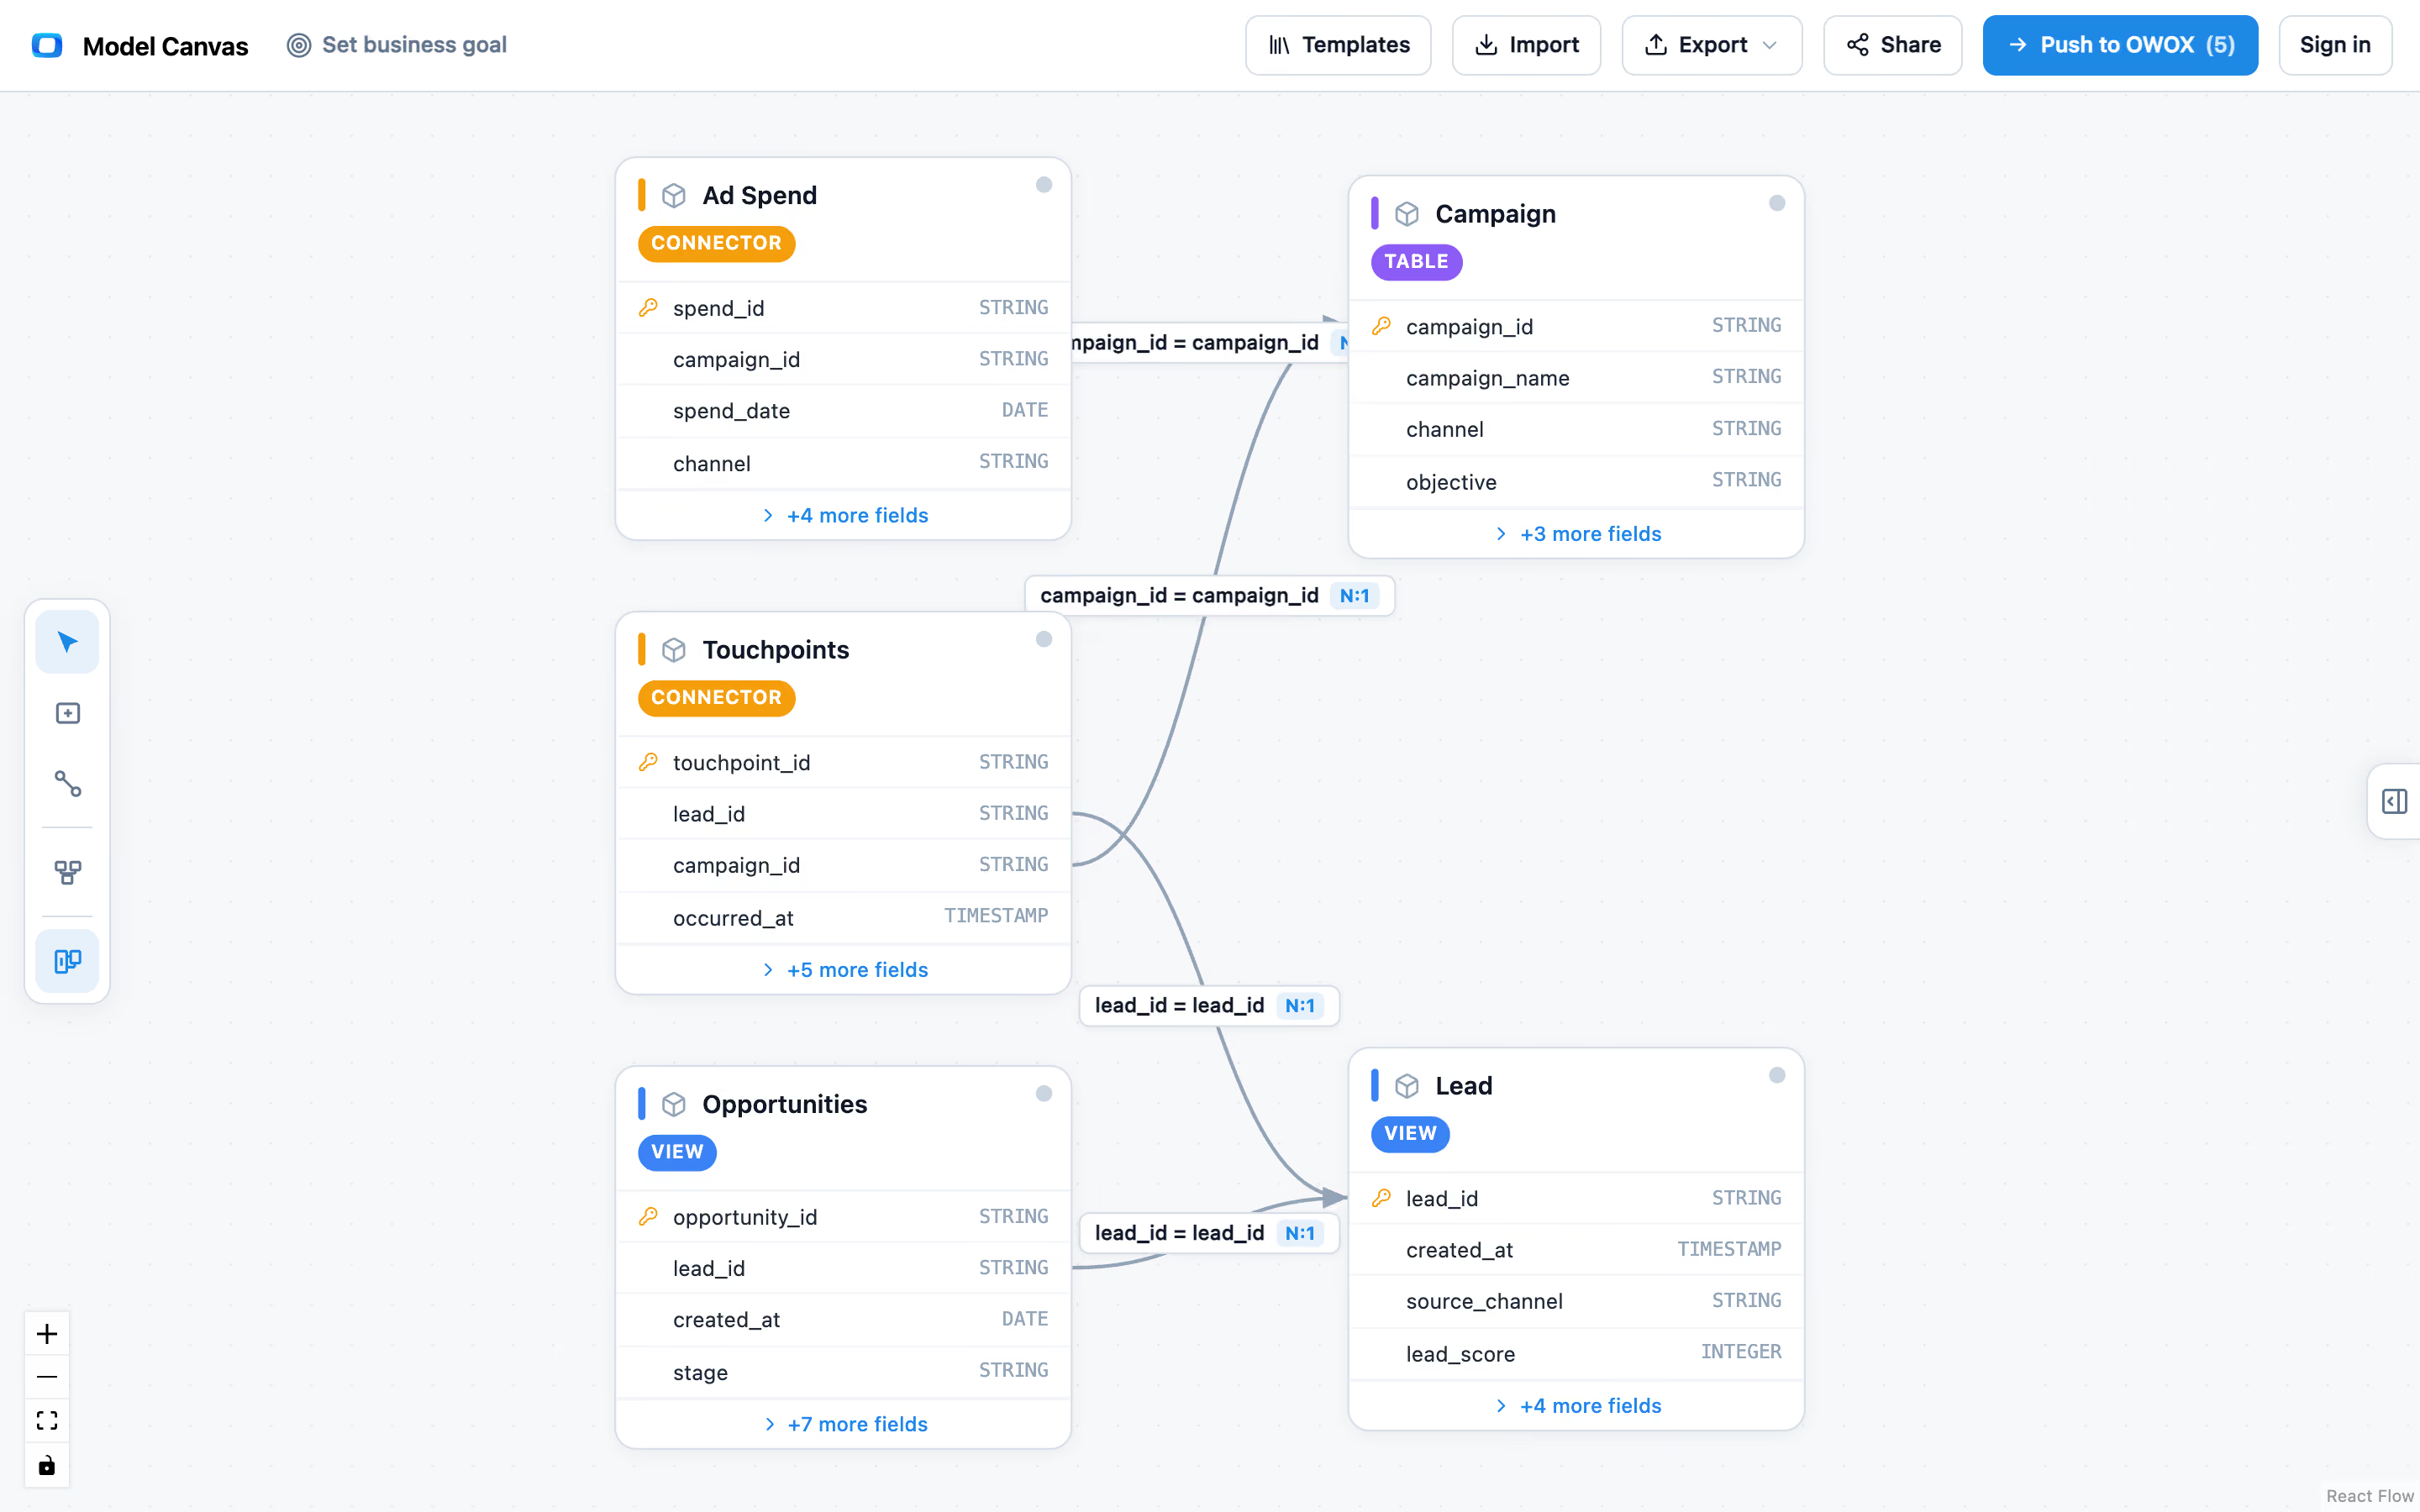
Your data becomes a joinable library
OWOX creates governed Data Marts. Join ad spend with revenue or GA4 sessions. One definition, reused everywhere.
Step 3
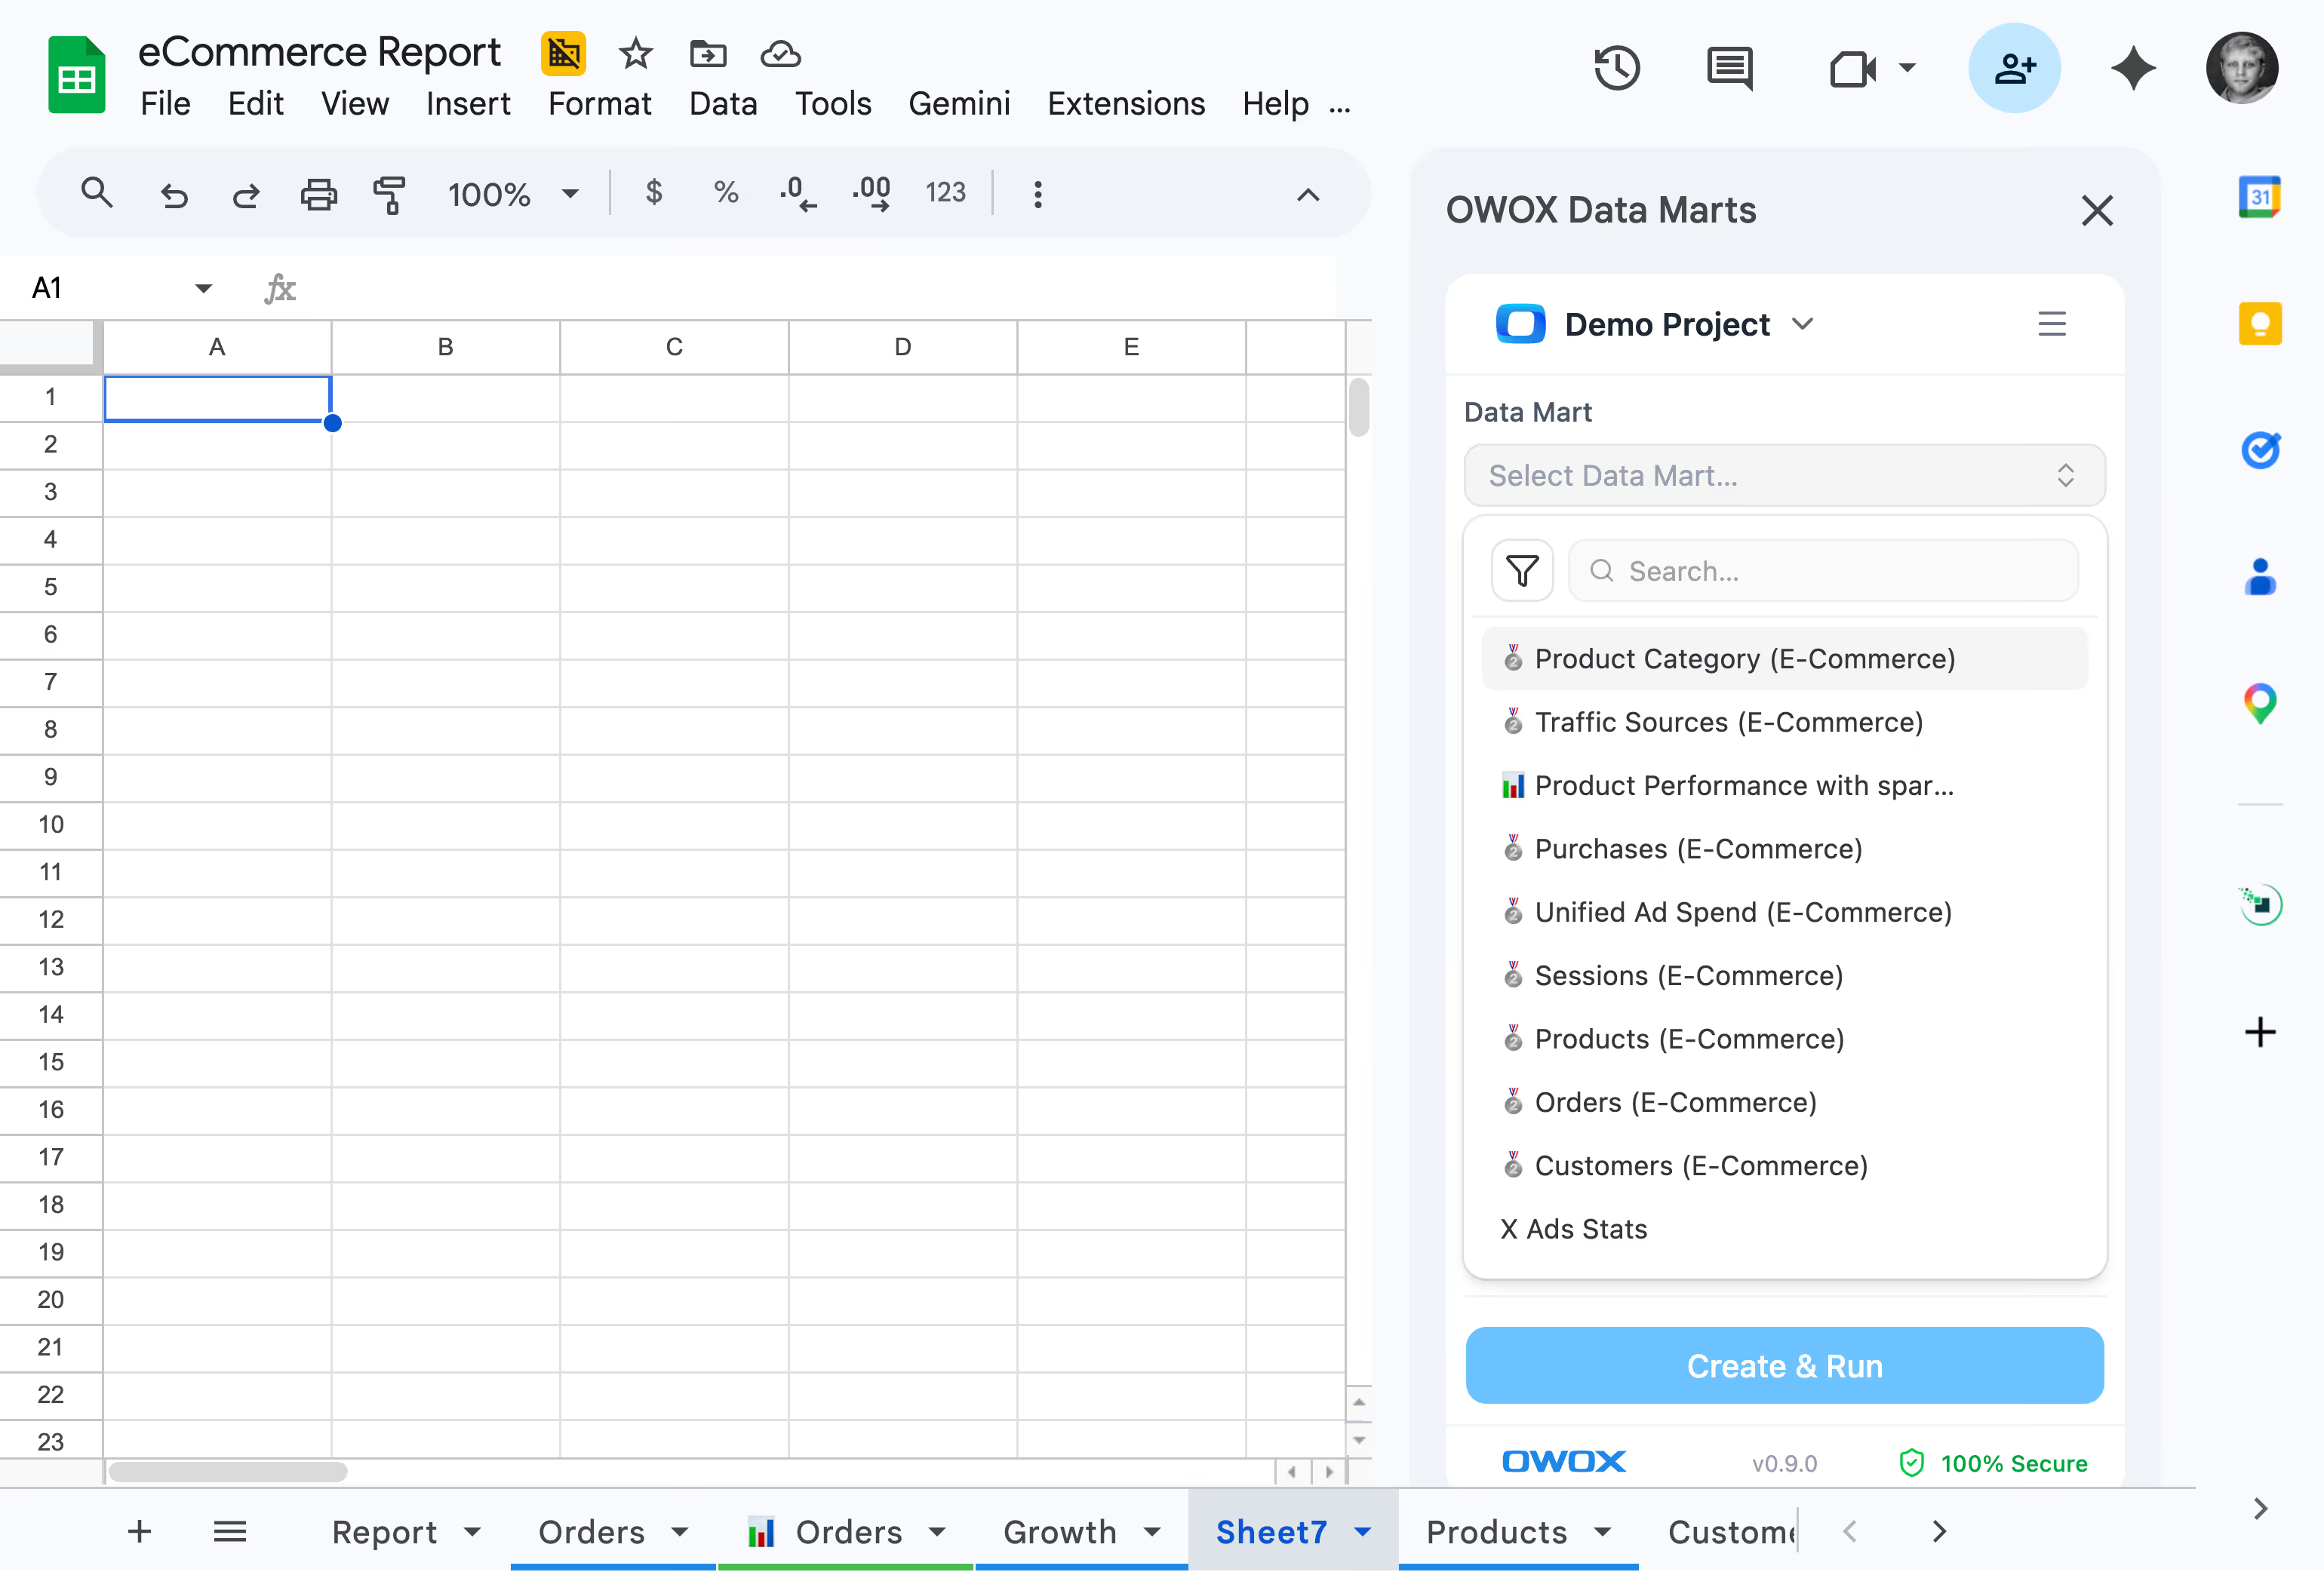
Self-serve in Google Sheets
Browse the library in Sheets, pick columns, schedule refresh. Cross-platform performance report your CFO can trust.
What changes for you
Stop reporting what platforms tell you
When your data lives in a warehouse and your reports pull from governed Data Marts, everything changes.

Defend your budget with real data
When someone asks "should we cut TikTok spend?" — you pull up cross-platform ROAS joined with actual revenue, not platform-reported conversions. You answer in 30 seconds with numbers that reconcile.

Real attribution, not last-click fiction
Join ad platform data with your CRM and revenue systems in the warehouse. See which campaigns actually drove revenue — not which platform claimed credit.

You become the person who knows
The marketer who can pull cross-platform data in Sheets, show real ROAS, and defend budget allocation is the marketer who gets promoted. That's you now.
What users are saying
What marketing teams say
Real things real customers said — each quote pinned to a specific claim, straight from the quotes database.
 Mark SimmonsCMO, Pürblack®
“We had six or seven different channels and no single source of truth — it was almost impossible, a lot of guesswork.”
 Nodari RizunFounder & CEO, Pürblack®
“Golden data is clean data — the measure of reality, true and not false, that you can trust based on its source. If you have that, you're good.”
Nodari RizunFounder & CEO, Pürblack®“Most businesses look at a Shopify or Google Analytics dashboard and think it's the source of truth. It's not — that data was never cleaned.”
WHERE THIS COMES FROM
Behind your self-serve reports: an analyst your data team hires once
The governed campaign library you pull from in Sheets is built and owned by a Reporting Analyst your data team deploys — define the joins once, the whole marketing team self-serves forever. And when you need the “why,” not just the “what” — that’s the Senior Analyst, answering in Slack, Claude, or ChatGPT. Leading the team, not building the reports? See the executive view → /solutions/cmo

Reporting Data Analyst
Builds your governed campaign library — every ad platform joined with revenue, self-served in Sheets.

Senior Data Analyst
Answers your “why” questions in plain language — @owox in Slack, or Claude and ChatGPT via MCP. Traceable to SQL.
Customer stories
Marketing teams also use warehouse-grade analytics
Marketing teams that stopped reporting platform numbers and started proving results
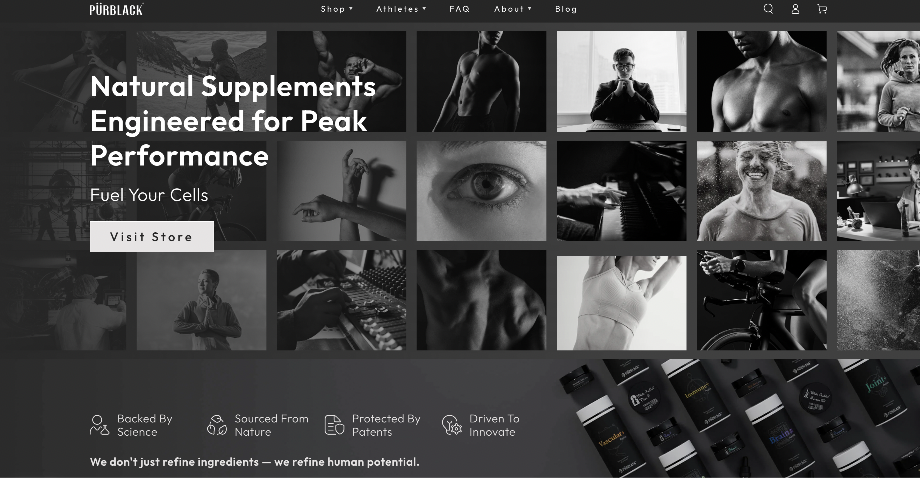 "For 10 years I was blind." The day Pürblack® founder stopped guessingSecondsto get reports across six channelsRead the story
  How OWOX Reports Helped Reformation Make Data-Backed DecisionsMinutesfrom data request to business decisionRead the story
  How OWOX Reports Streamlined Operations for WorkSimpli, Saving Over 10 Hours Weekly10hrs+saved per week on manual reportingRead the story
 FAQ
Questions marketing teams ask
Do I need to know SQL to use OWOX?
No. The connectors pull data automatically — you pick the platform and click connect. Data Marts can be created from your imported data with one click — OWOX auto-generates the schema, aliases, and join keys. When you need a report, you open Google Sheets, browse the Data Mart library with the column picker, and hit refresh. The entire flow from "I have ad accounts" to "I have a cross-platform report in Sheets" is point-and-click. If you want to go deeper — custom joins, calculated metrics, advanced transformations — you can write SQL. But you don't have to start there, and many teams never need to.
Do I really need a data warehouse? Can’t I just use Google Analytics?
Google Analytics tells you what happened on your website. It doesn't tell you what happened across Facebook Ads, TikTok, LinkedIn, your CRM, and your revenue system — together. When your CFO asks "what's our real ROAS by channel?", GA4 can't answer because it only sees one slice. A data warehouse is where all your data lives together — ad spend from every platform, revenue from Shopify or Stripe, sessions from GA4 — joined, governed, and queryable. OWOX makes the warehouse practical for marketers: connectors pull the data in, Data Marts join it, and the Sheets Extension lets you self-serve. BigQuery has a generous free tier. You can start free with OWOX.
Which ad platforms does OWOX support?
Facebook Ads (Meta + Instagram), Google Ads, TikTok Ads, LinkedIn Ads, Microsoft Ads (Bing), X Ads (Twitter), Reddit Ads, Criteo Ads, plus Open Exchange Rates for multi-currency reporting. If you need a platform we don't support yet, the connector framework is MIT-licensed — you can write a custom connector and plug it in. Every connector includes production-grade defaults: backfill, lookback windows, rate-limit handling, and automatic retry.
How is this different from Supermetrics or Funnel.io?
Supermetrics and Funnel pull raw data from ad platforms and dump it into Sheets or a warehouse. That's where they stop. You still need to model the data, define metrics, maintain joins, and build reports from scratch — and every report is a separate sync with duplicated logic and different numbers. OWOX goes further. Connectors pull data into your warehouse, then Data Marts govern it — aliases, join keys, ownership, descriptions. When a marketer opens Sheets, they don't see raw API columns. They see "Cost per Acquisition" and "Revenue by Channel" in a column picker. They join ad spend with revenue using pre-approved keys. One Data Mart feeds every report. Numbers reconcile because the definition lives in one place. Supermetrics is a pipe. OWOX is a pipe plus a governed library plus a self-service column picker in Sheets.
What does it cost?
OWOX is free to start — 30 one-time credits, no credit card required. The Reporting Analyst tier is from $65/month with 50 credits. The Senior Analyst — which adds conversational answers in Slack, Claude, and ChatGPT — is from $90/month with 75 credits. Enterprise pricing is custom with SSO, permissions, and dedicated support. If you want maximum control, the self-managed Community edition is free forever on your own infrastructure. BigQuery's free tier covers most marketing teams' data volume, so your total cost to get started is effectively zero.
I already have a data analyst on my team. How does this help?
Even better. Your analyst connects the warehouse, builds the Data Mart library with proper governance and join keys, and publishes it. From that point on, you — and everyone on the marketing team — self-serve from the library in Google Sheets. Your analyst stops fielding "can you pull Facebook spend by campaign for last quarter?" tickets and starts working on actual analysis: attribution modeling, incrementality testing, media mix optimization. You get your data faster. They get their time back. The reporting backlog disappears because the hand-off is built into the product. That's what the Reporting Analyst hire automates — your analyst sets it up once, every marketer self-serves forever.