
Solution
NewOWOX MCP — your product metrics, accessible and handy
You're buying next season on gut... Let's Fix That.
OWOX gives merchandising direct access to governed product data — sell-through, returns-adjusted margin, repeat purchase by SKU — right from Claude or ChatGPT. One-click in Google Sheets. No analyst queue. No CSV exports. No reordering blind.
The analytics system 170,000 spreadsheet users already trust
Marketplace users
175K+
teams running OWOX from the Google Workspace Marketplace
G2 rating
4.9
296 verified reviews on G2
Connector downloads
156K+
open-source connector installs via npm
GitHub stars
231
the platform is open source — star it, fork it, self-host it
The product data problem
Your product data lives in 6 systems. None of them talk to each other.
"Which categories drive repeat purchases?" requires joining orders, marketing attribution, and customer behavior from three systems. Your analyst spends a week. By the time the answer arrives, the promotion is over.
How product data works today
Ask the analyst. Wait a week. Get a partial answer.
- "Reorder rate by category?" — requires joining 3 systems. Takes a week.
- Analyst builds a one-off query for every cross-system question — then throws it away
- Marketing says campaign drove $2M. Product sees $1.4M. Gap is invisible.
- Inventory decisions based on last month’s numbers — real-time data doesn’t exist
- Category reviews start with "let me pull that" — and end without the answer
With OWOX
Every system’s data. One library. Answers in seconds.
- Product, customer, marketing, and inventory data — joined in one library
- Browse "Category Performance" and "Customer Cohorts" in Sheets — pick, filter, refresh
- Cross-system joins defined once — reused in every report and meeting
- AI weekly briefs — top categories, cohort trends, inventory alerts
- Category reviews start with data that’s already there
Product decisions improve when you can join every system’s data in seconds instead of waiting weeks.
F04 · Cross-system joins
Every system’s data. One governed library.
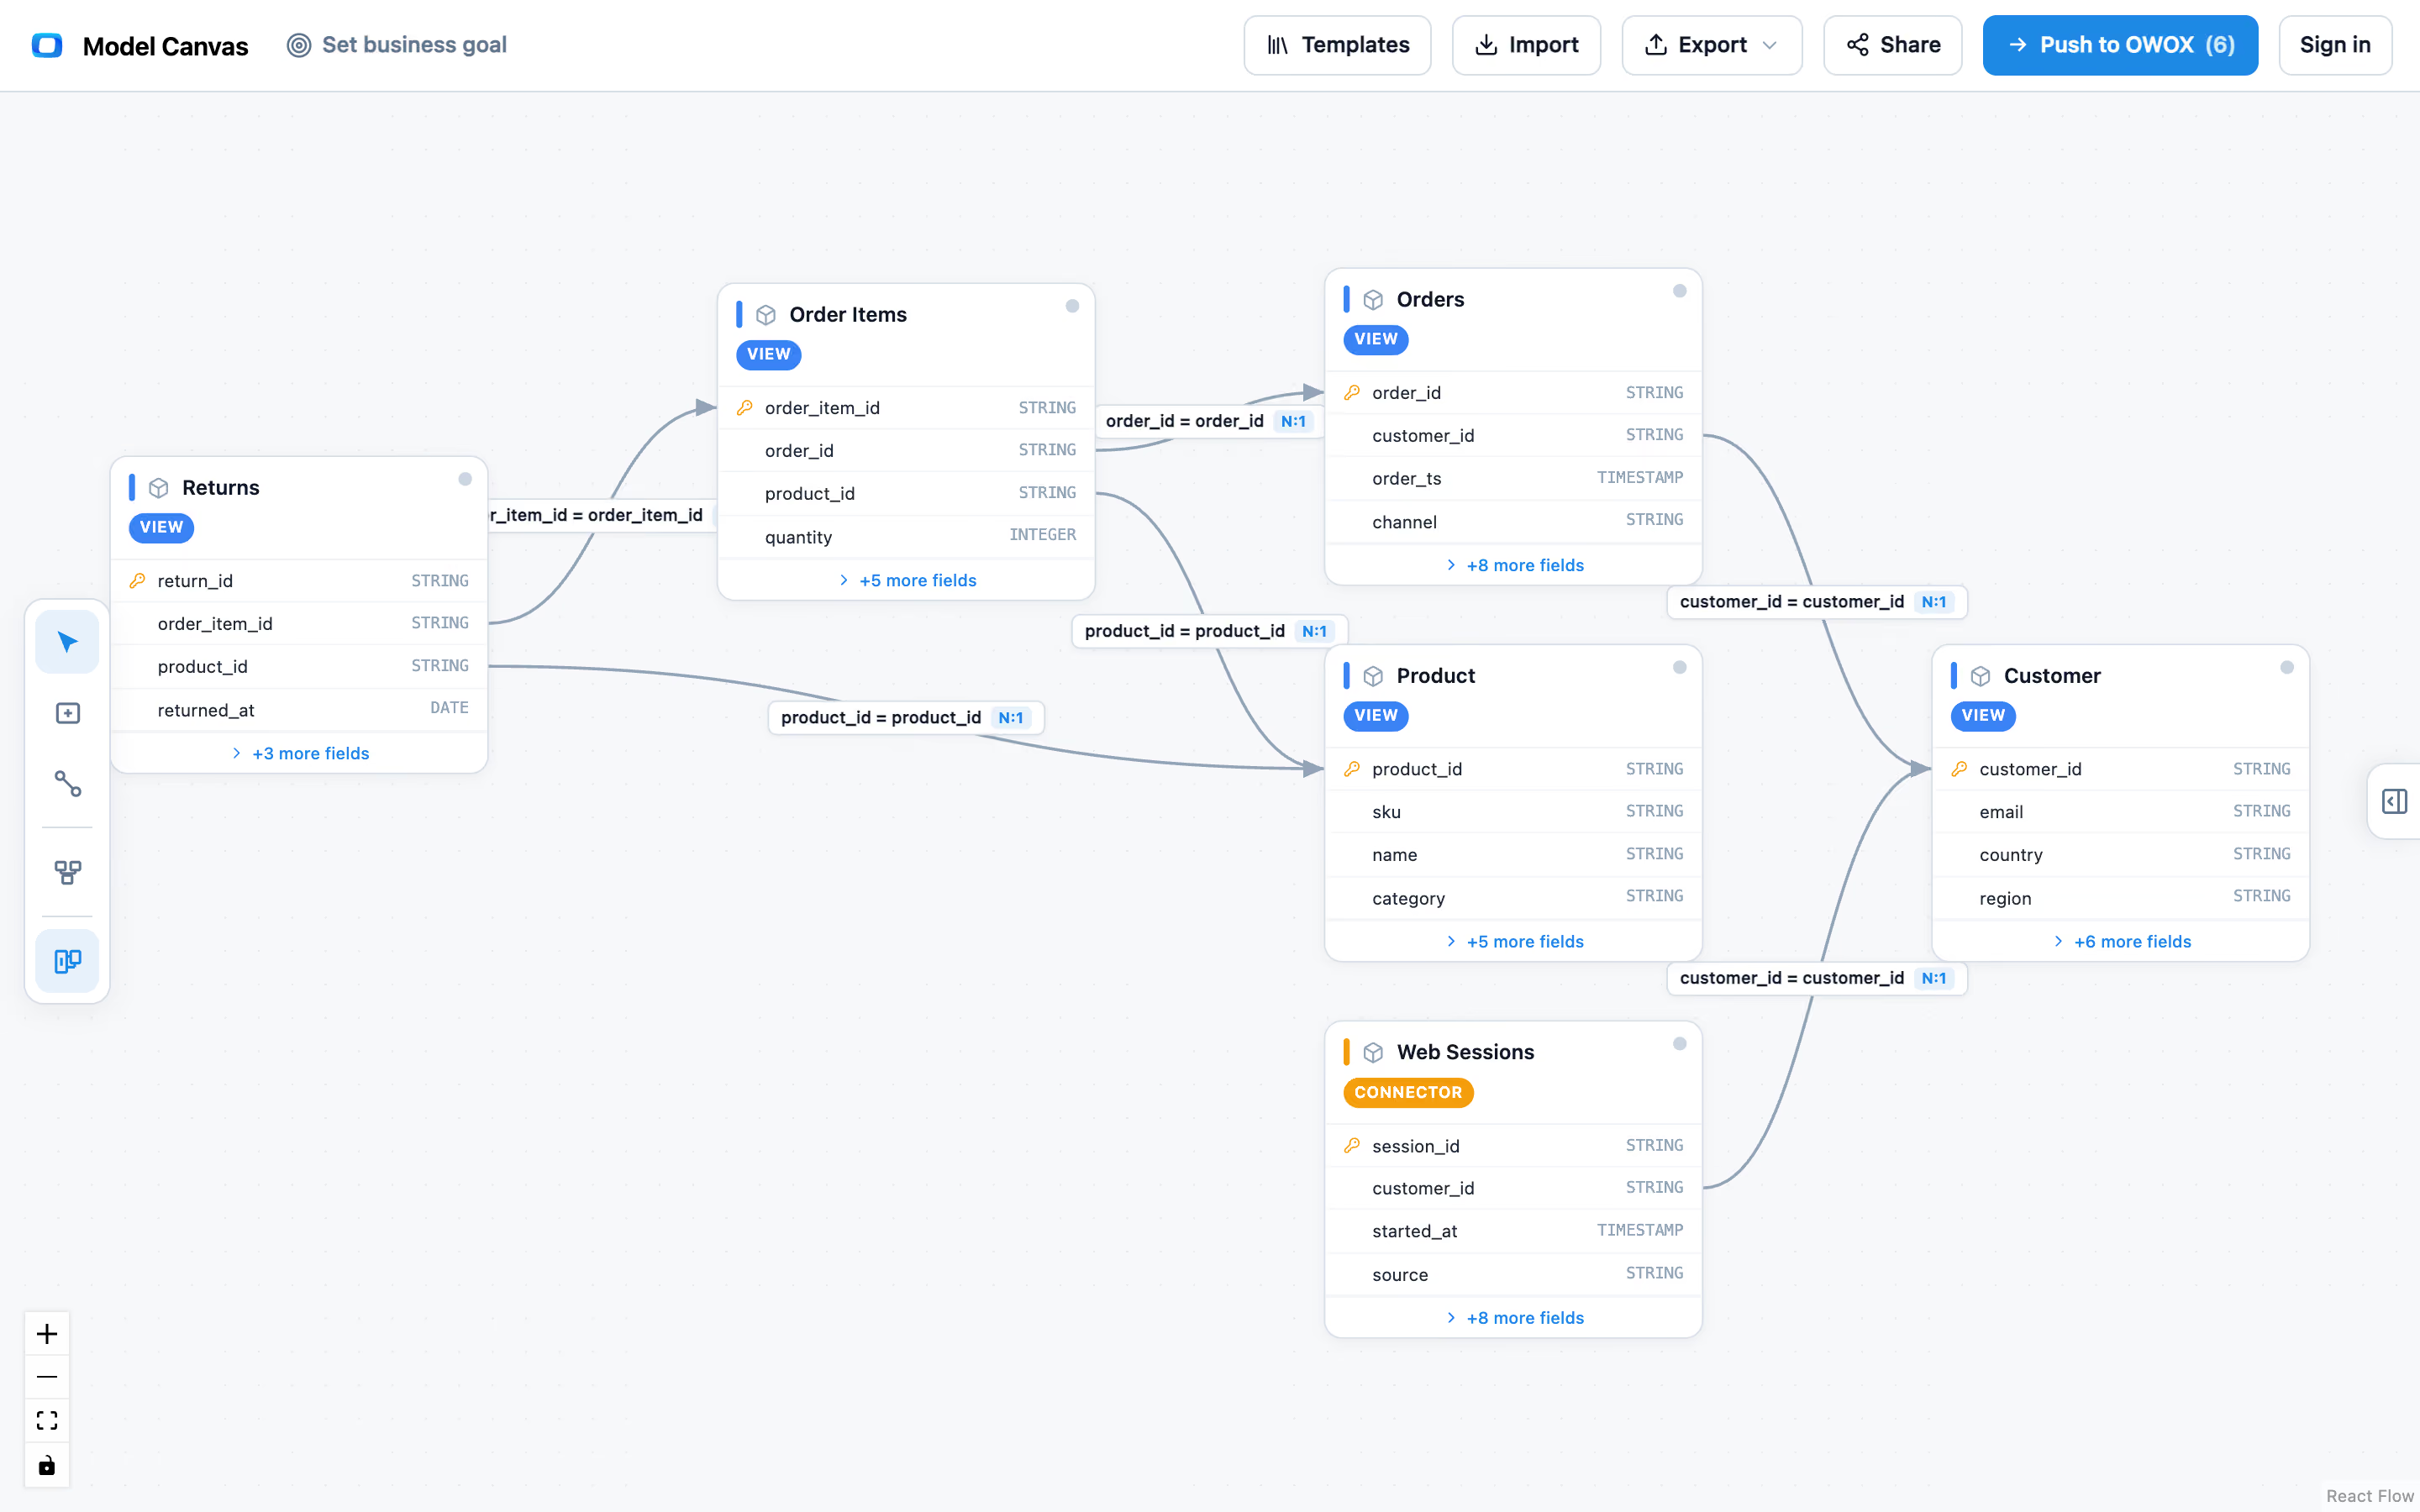
Your data team joins product data from every system in the warehouse and publishes it as a governed library. Every metric gets one definition, one owner.
- Product performance joined with marketing attribution — see which campaigns moved which categories
- Customer cohorts joined with order data — repeat purchase rates, LTV by channel, churn signals
- One definition per metric across product, marketing, and finance — no more reconciliation
F05 · Self-serve product data
Your product team self-serves — here’s how.
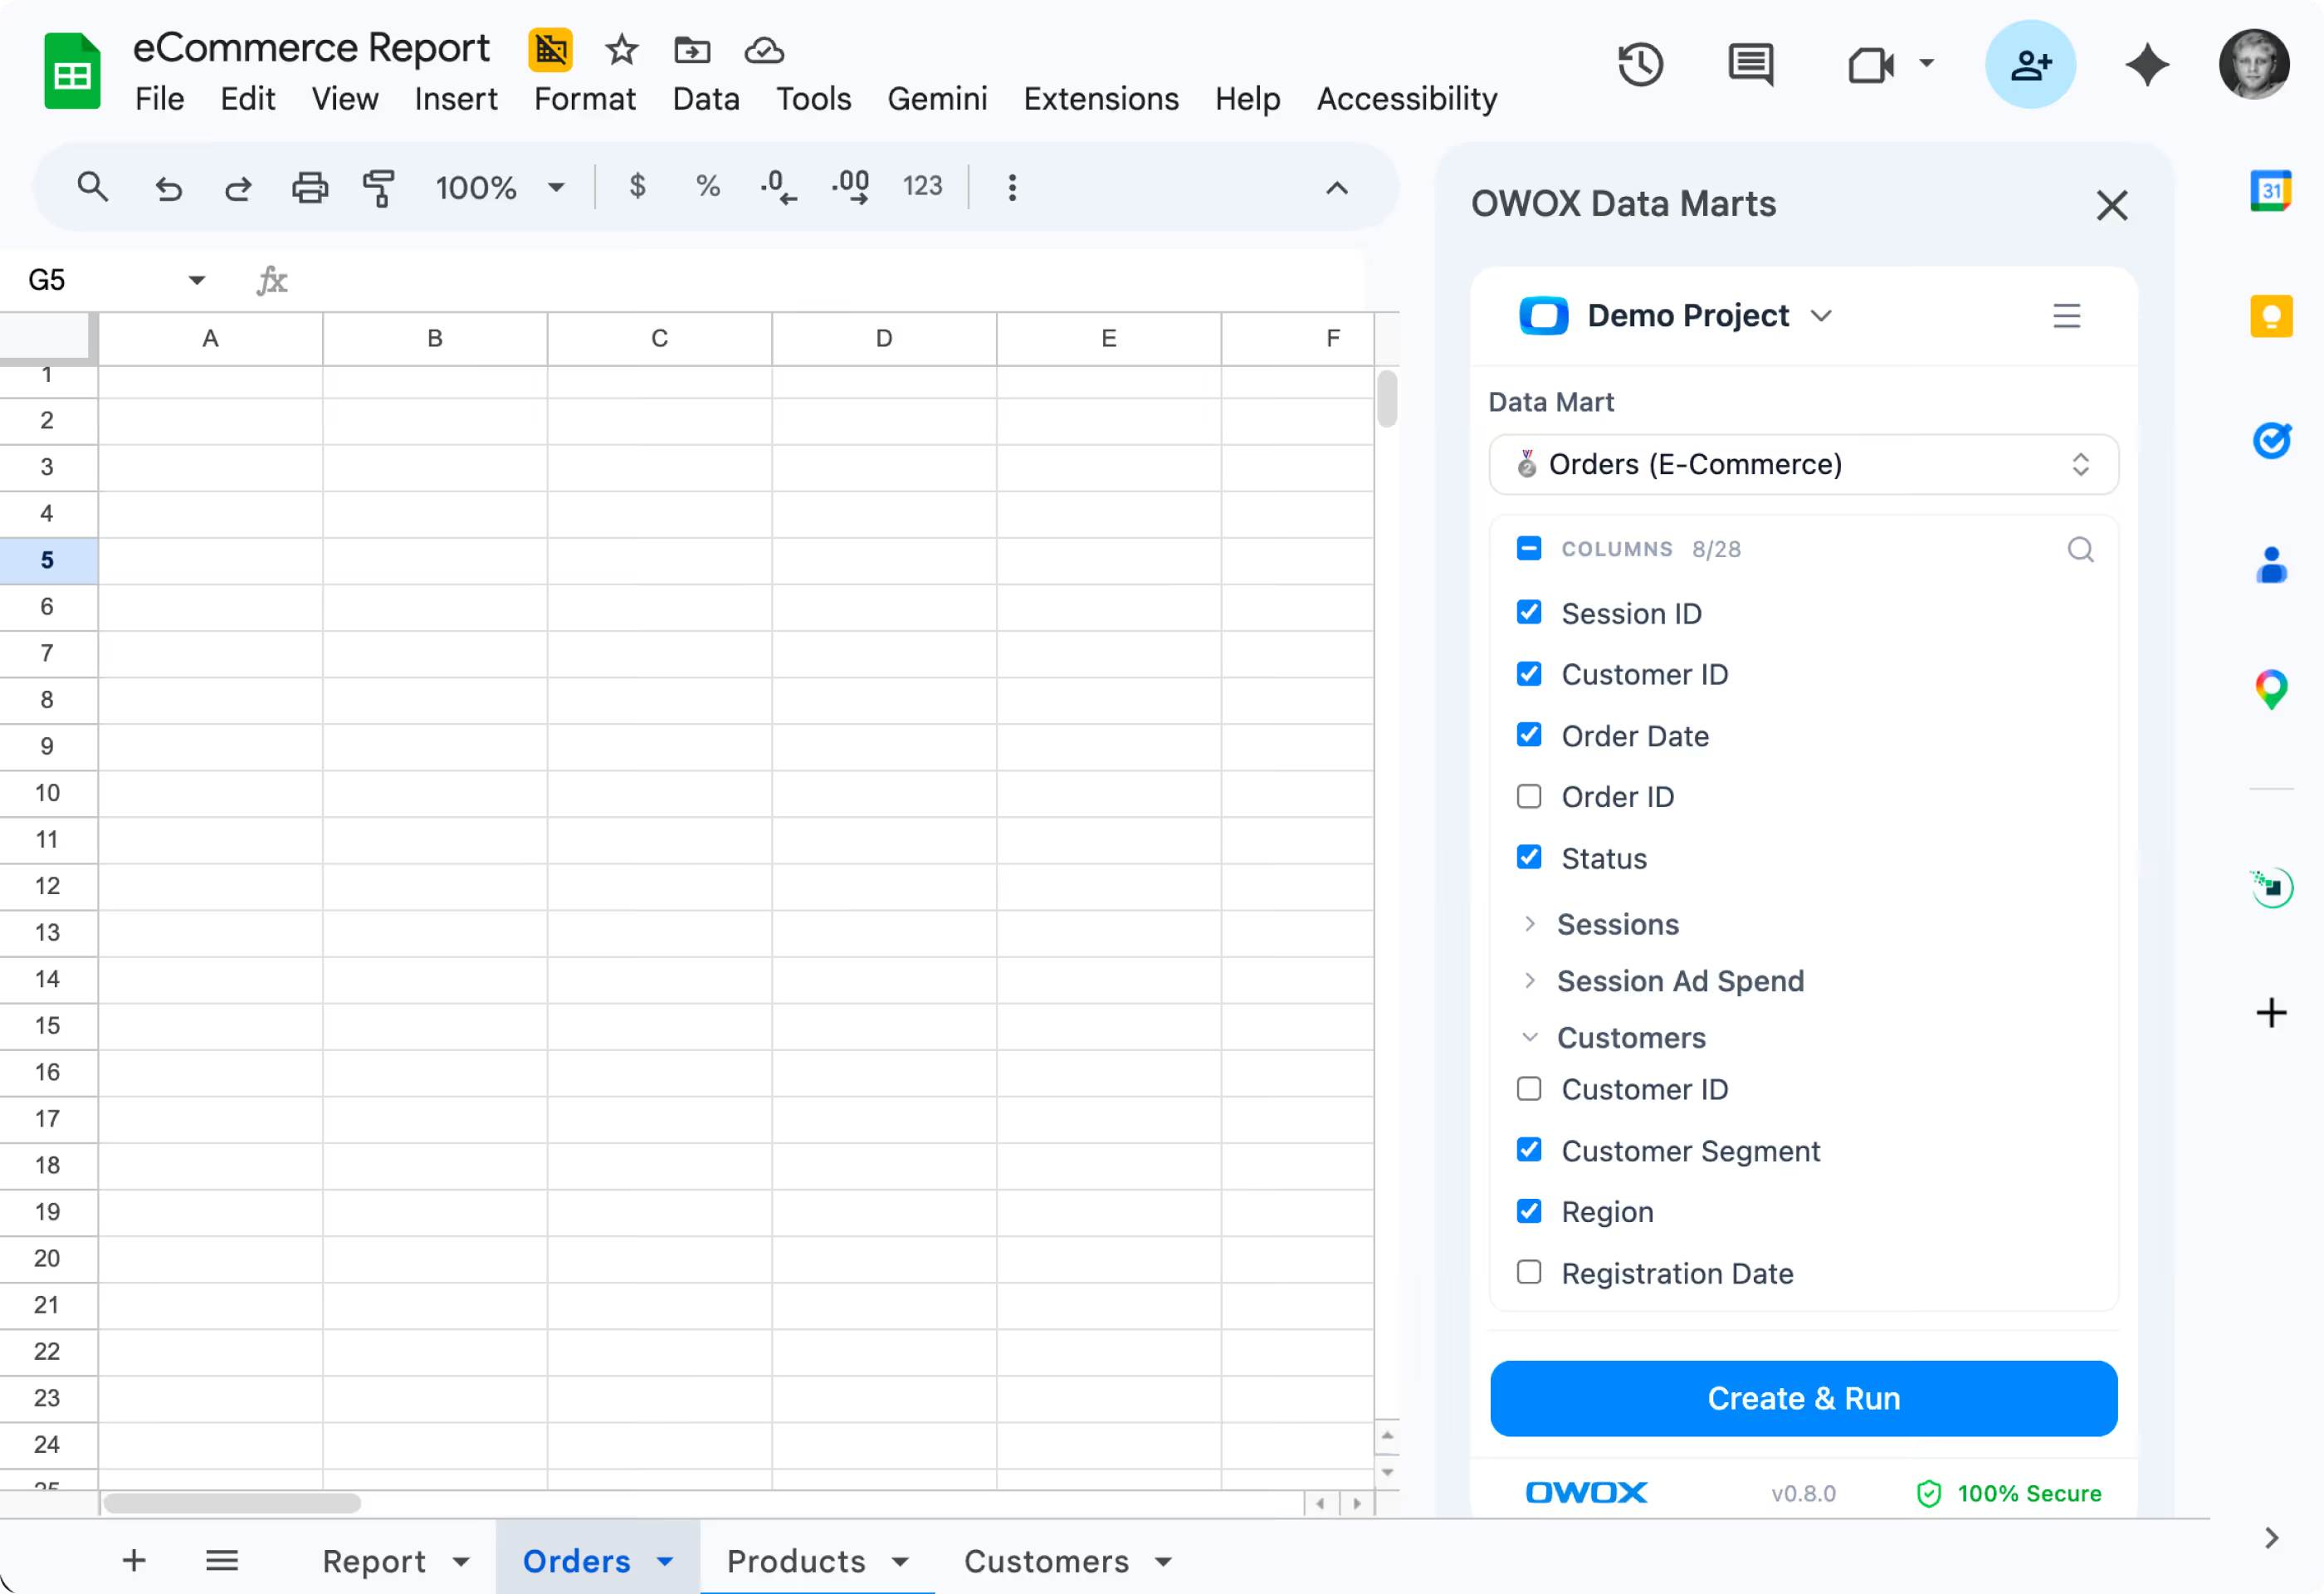
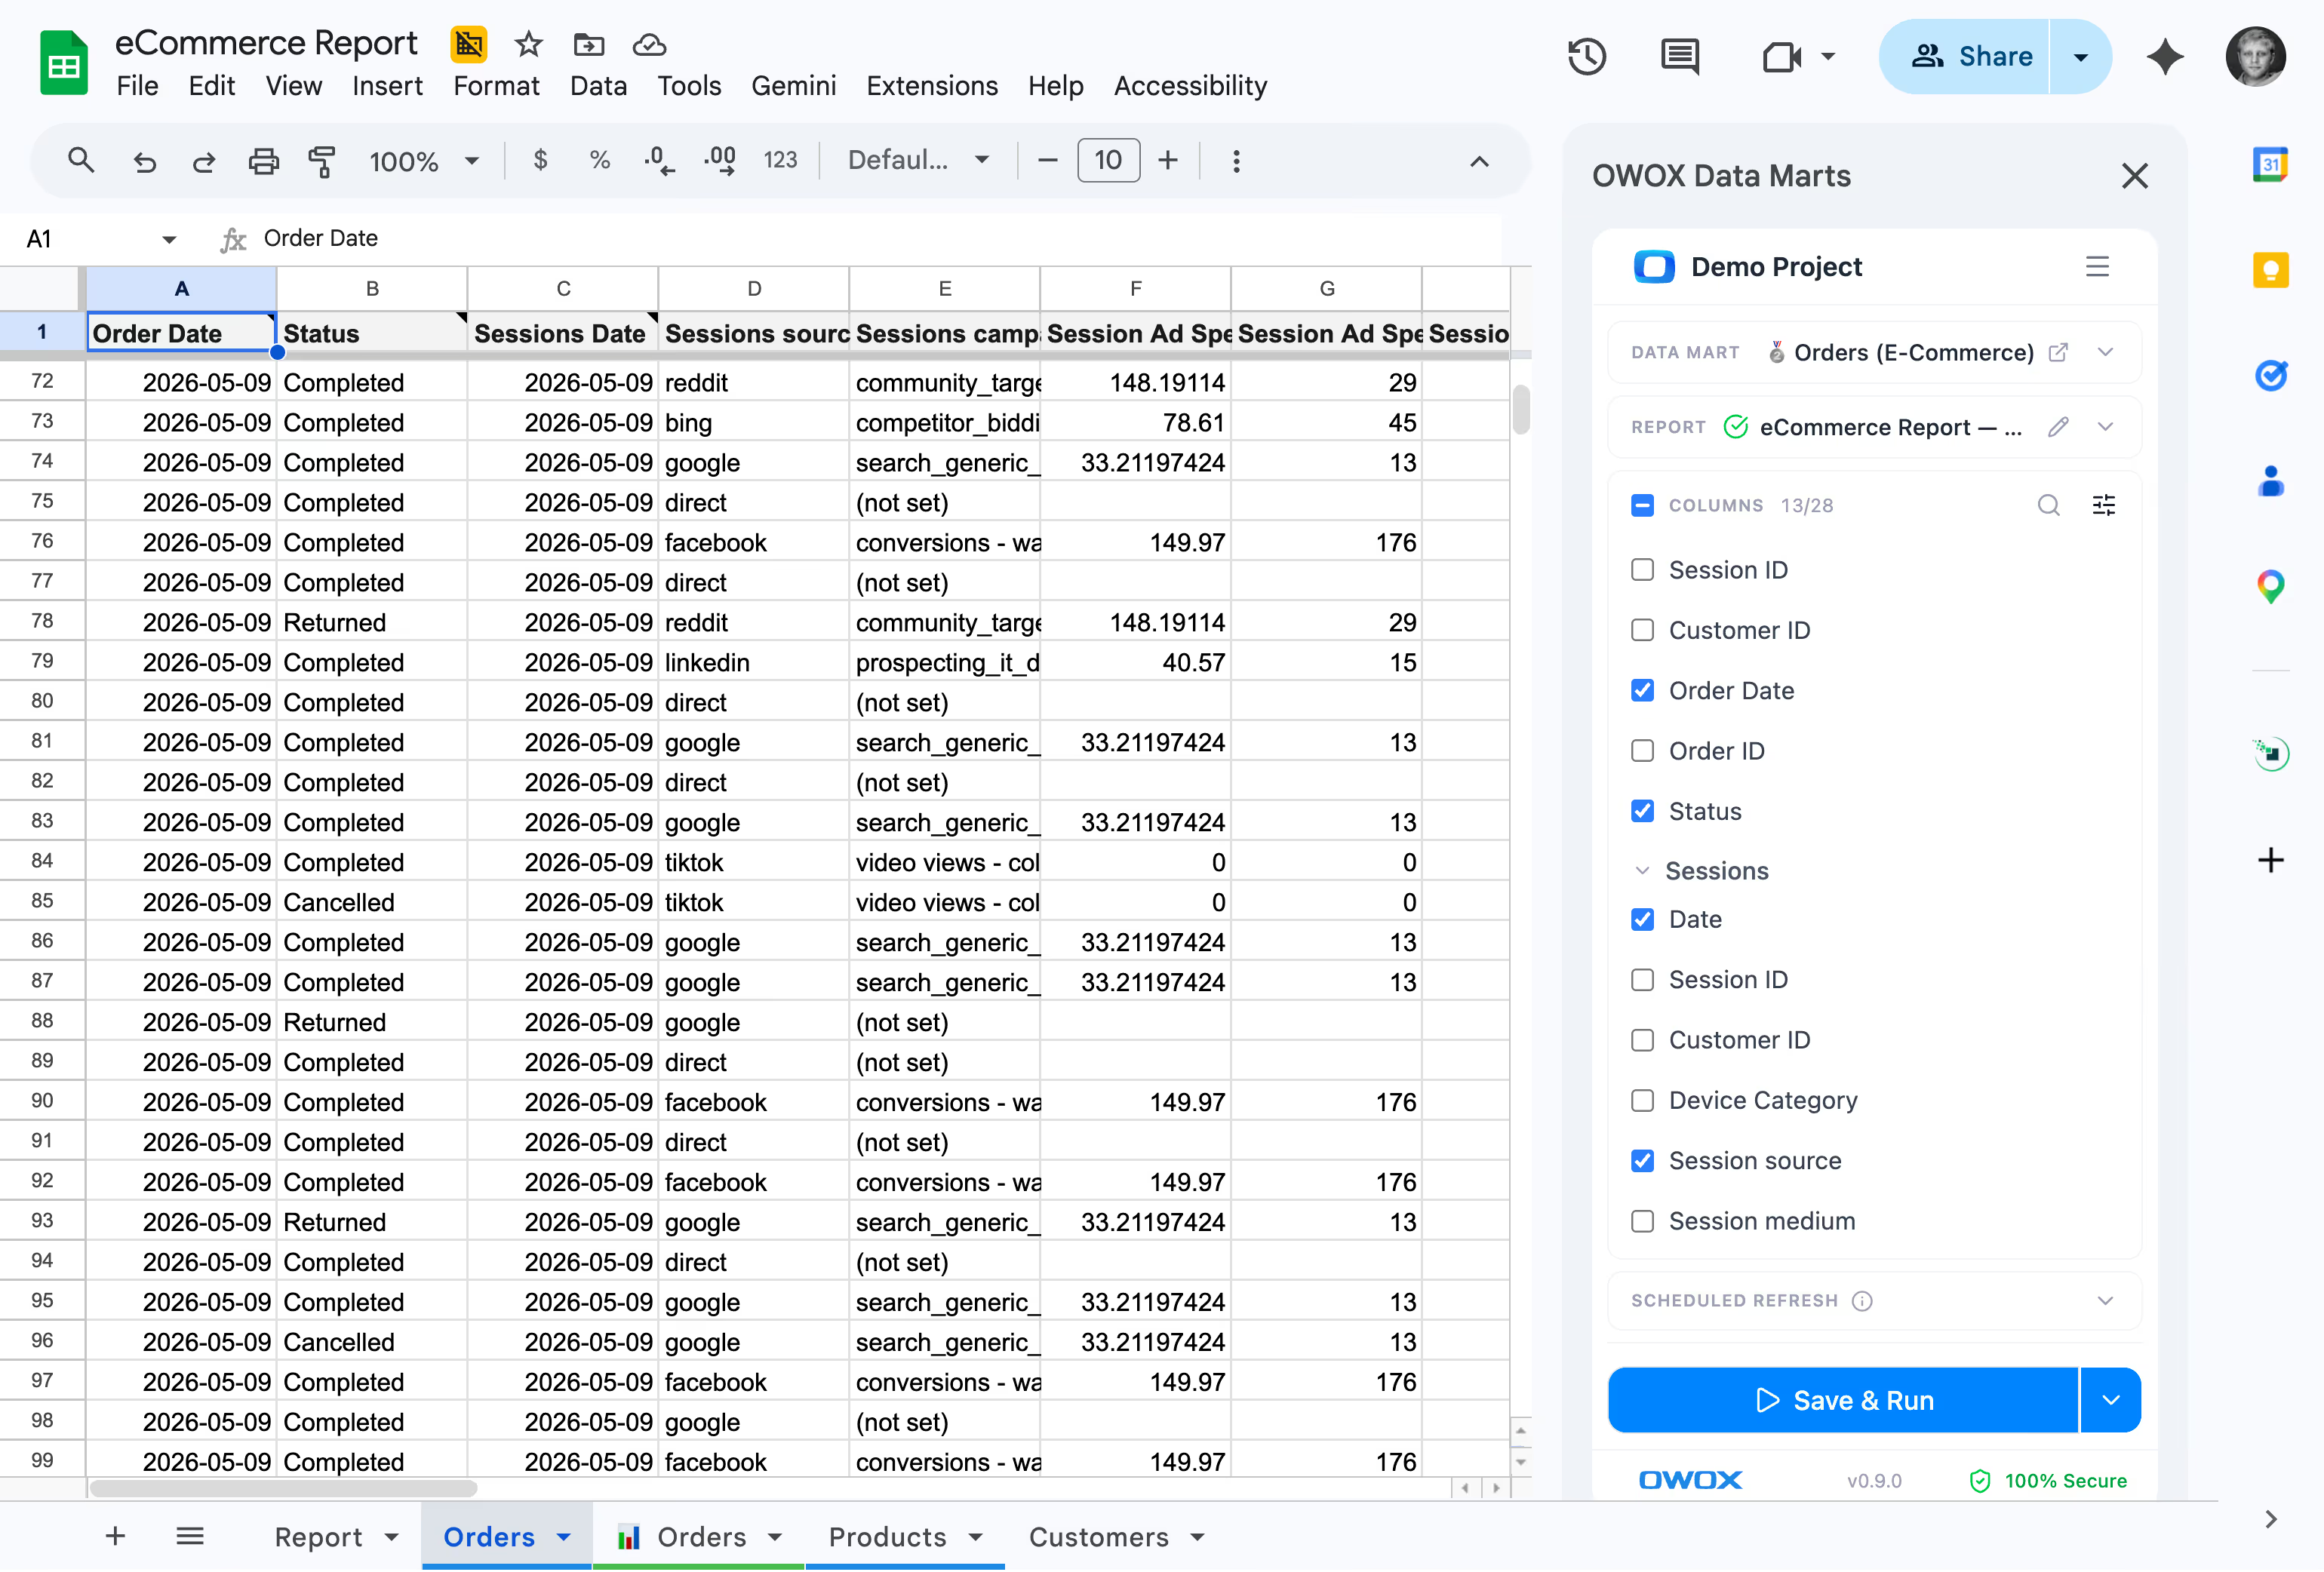
Category managers browse the joined library in Google Sheets, pick columns like “Revenue by Category” or “Reorder Rate,” and refresh daily — no SQL, deterministic, traceable.
- Column picker shows "Revenue by Category," "Reorder Rate," "Days of Stock" — business-friendly names
- Join product Data Marts with marketing or customer Data Marts using pre-approved keys — no SQL needed
- Every cell is deterministic, traceable, verifiable — patented technology, zero hallucinations
F06 · Product intelligence
Weekly product brief. Top categories. Cohort trends. Inventory alerts.
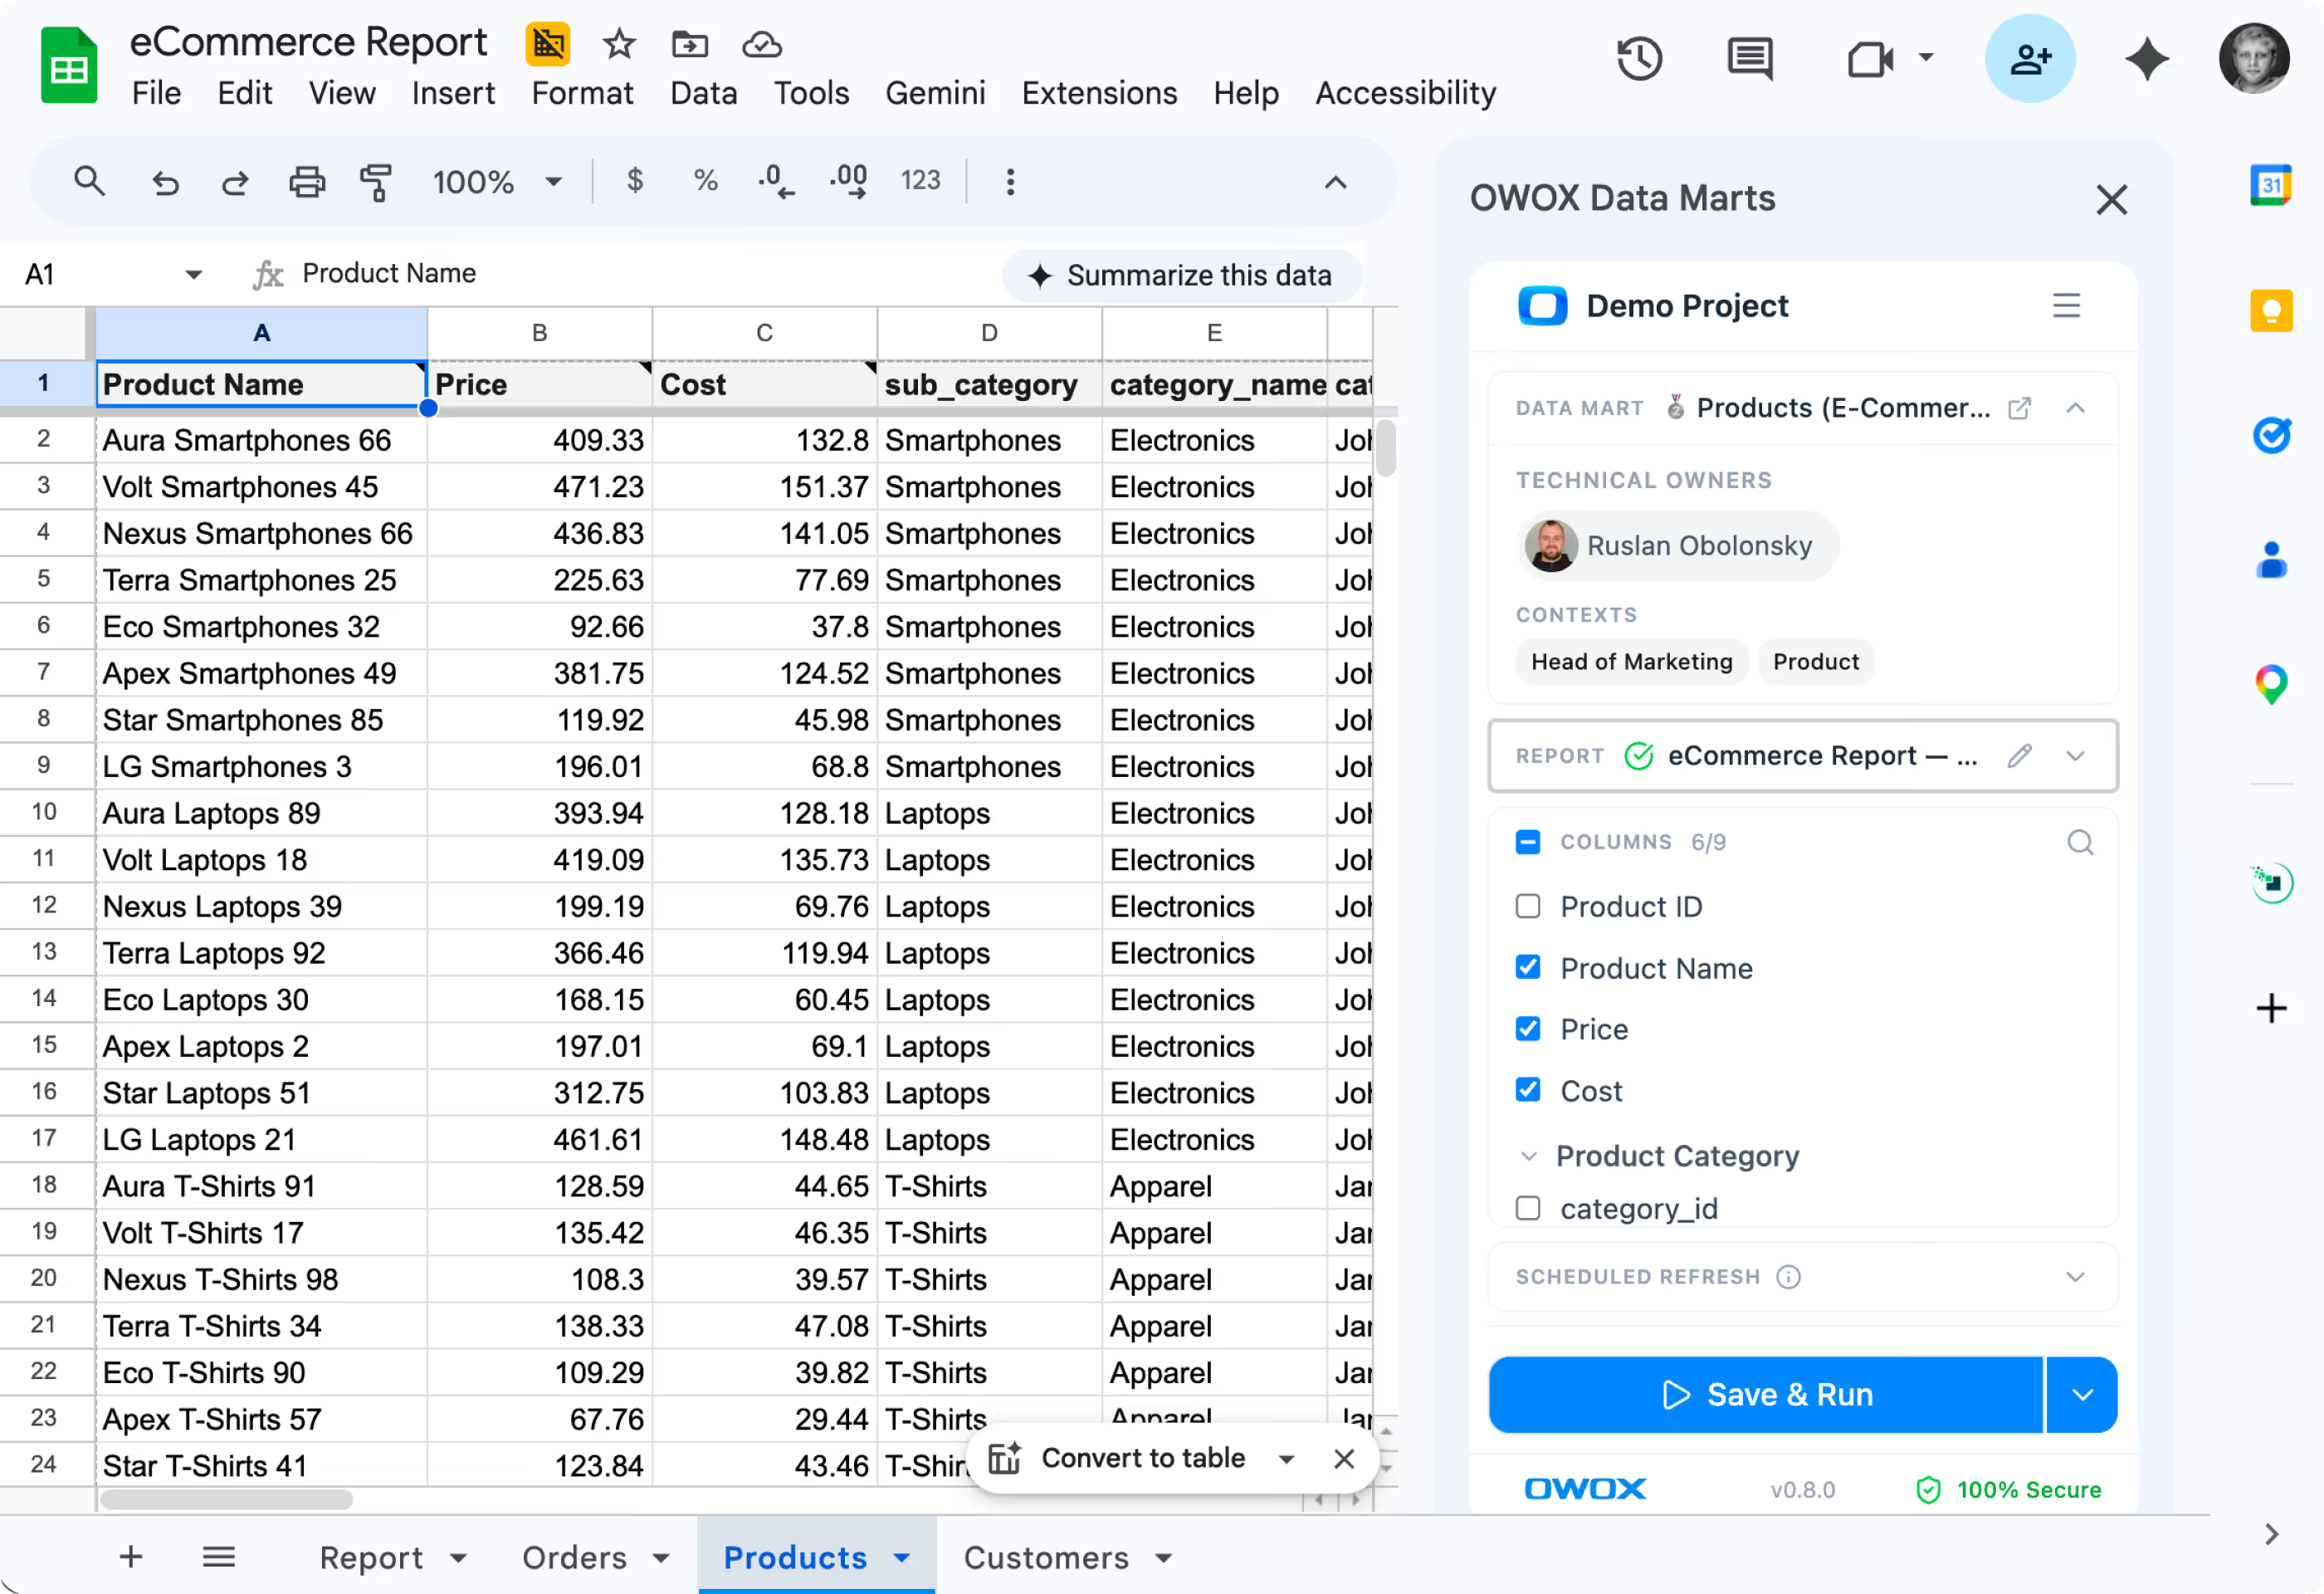
Insights turn your product Data Marts into recurring narratives delivered on schedule. AI writes the summary. Every metric is deterministic SQL.
- Category performance — revenue trends, margin shifts, sell-through rates — auto-generated weekly
- Cohort alerts — "Repeat purchase rate for Q1 cohort dropped 12% vs. Q4" flagged automatically
- Patented technology — AI narrates product trends, never invents the numbers
F07 · OWOX MCP
Ask a product question. Get a cross-system answer in your AI chat.
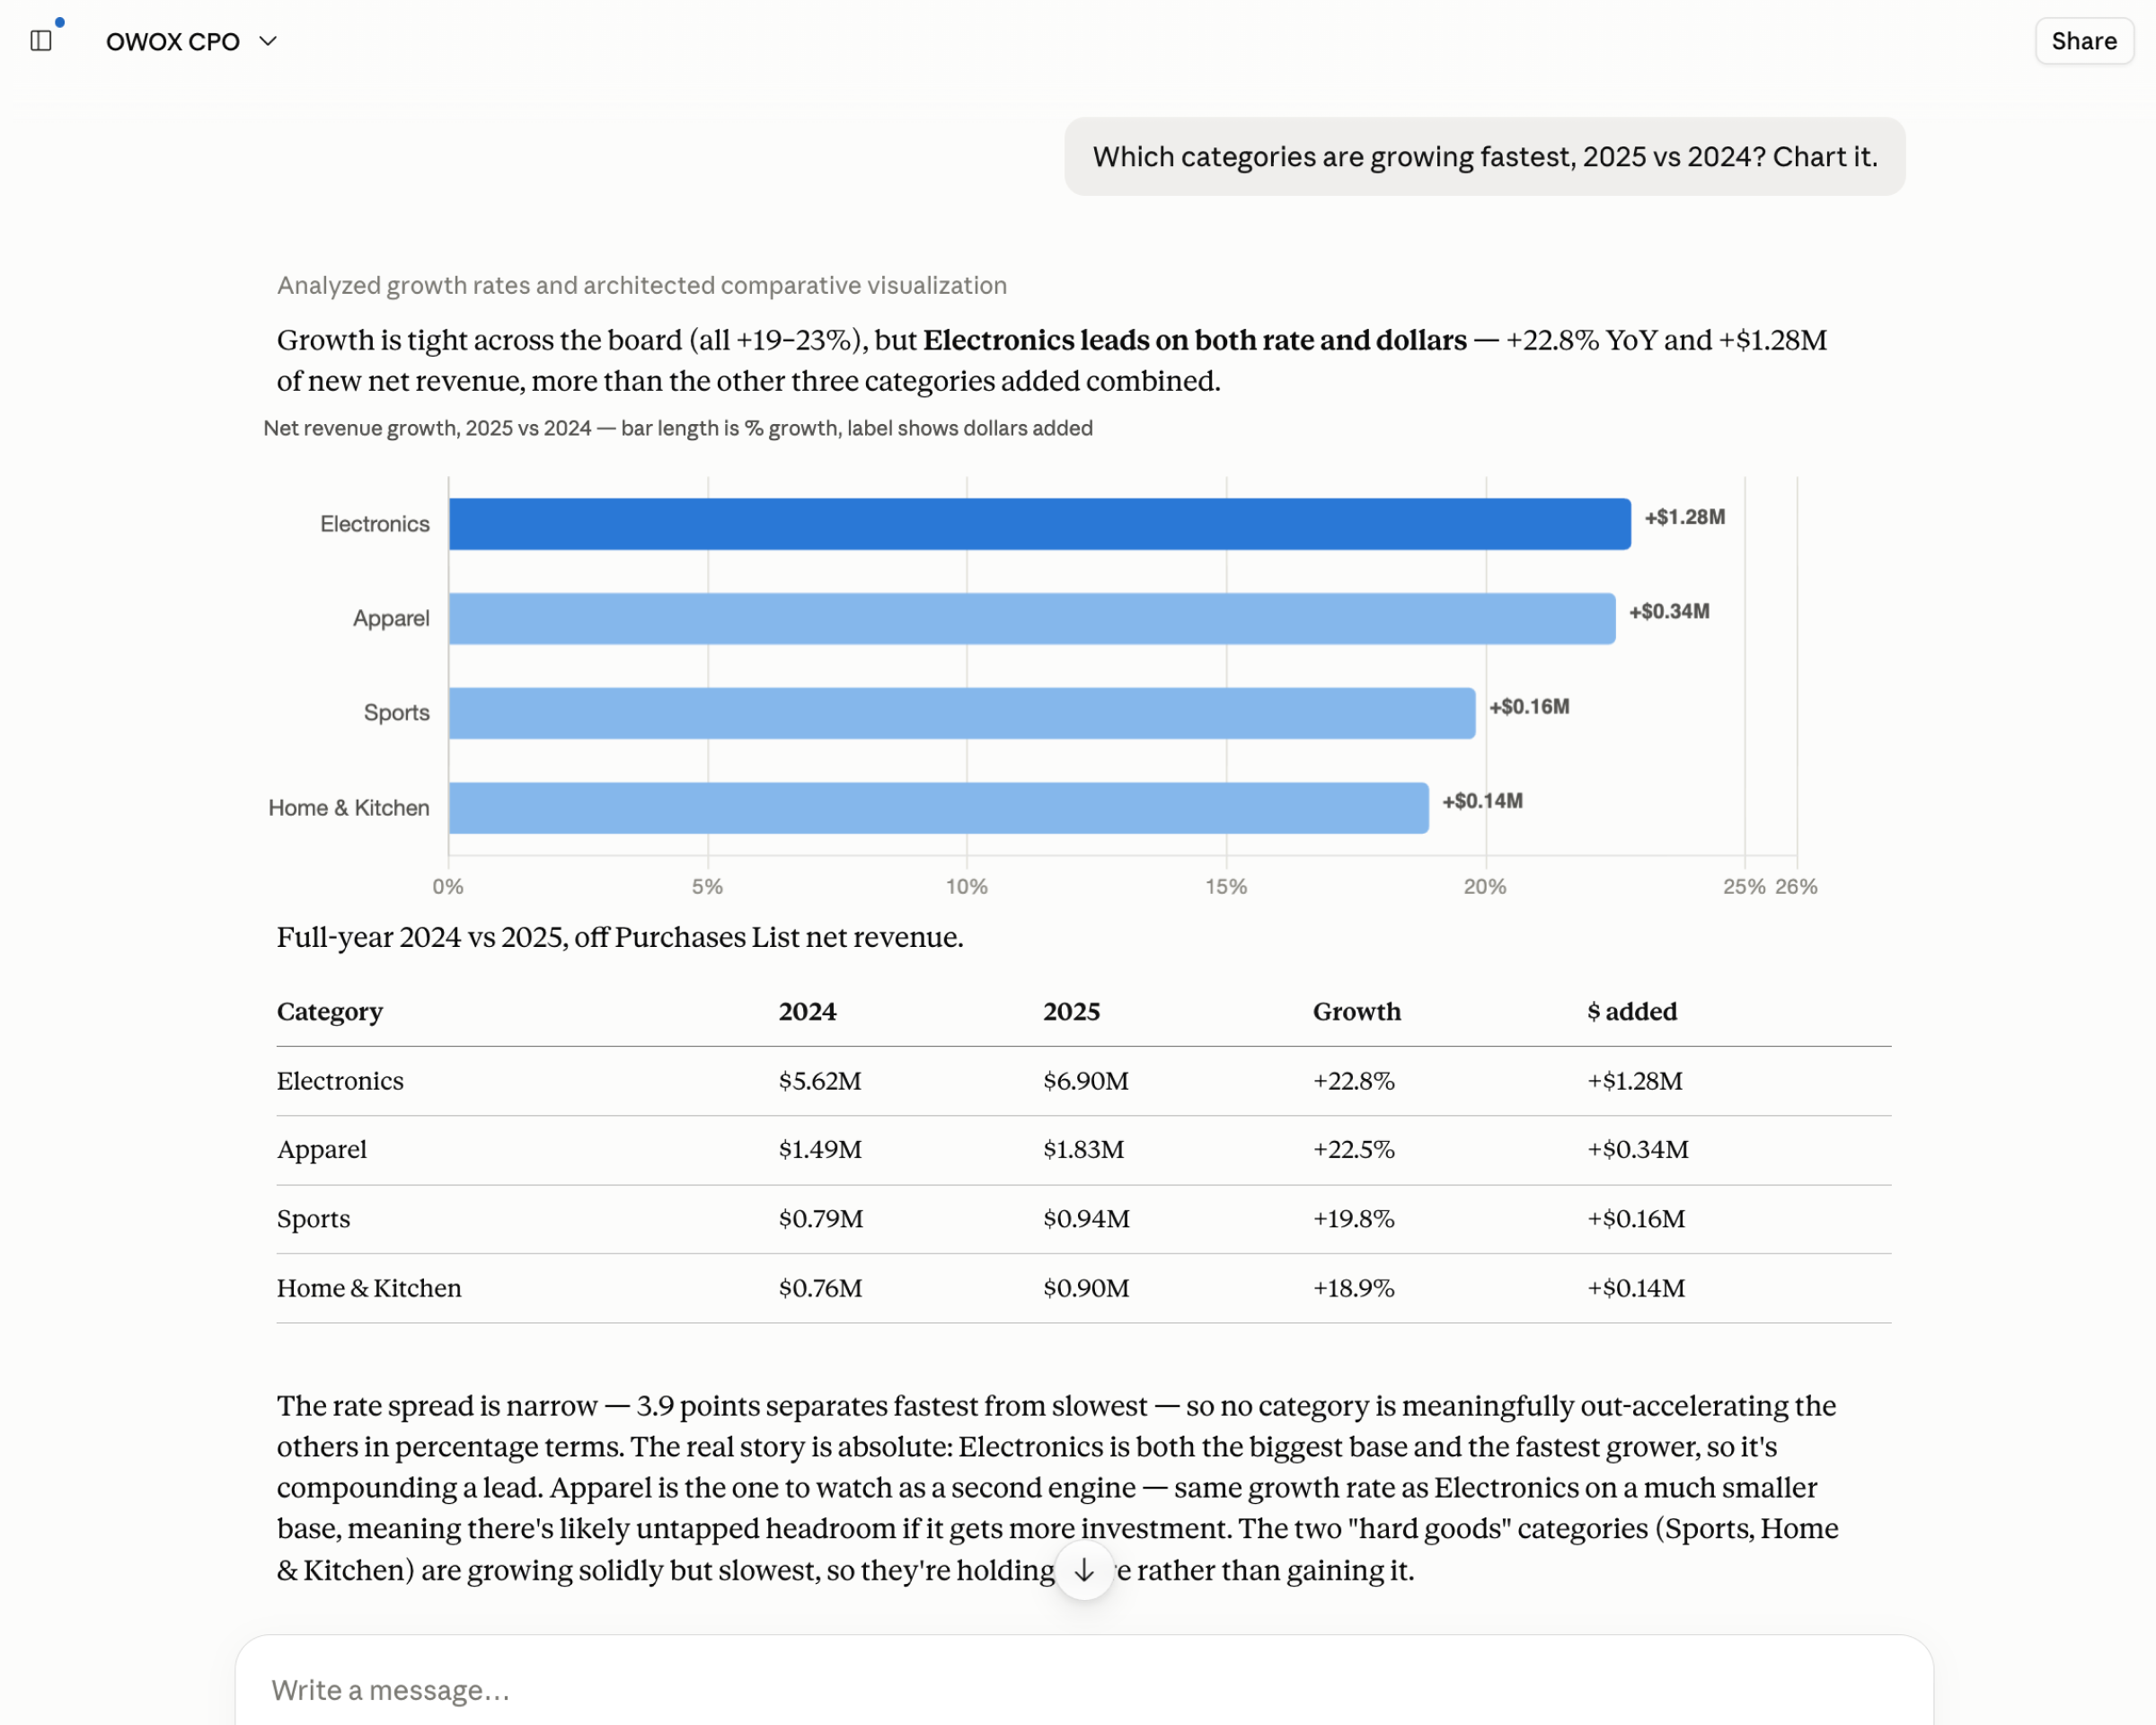
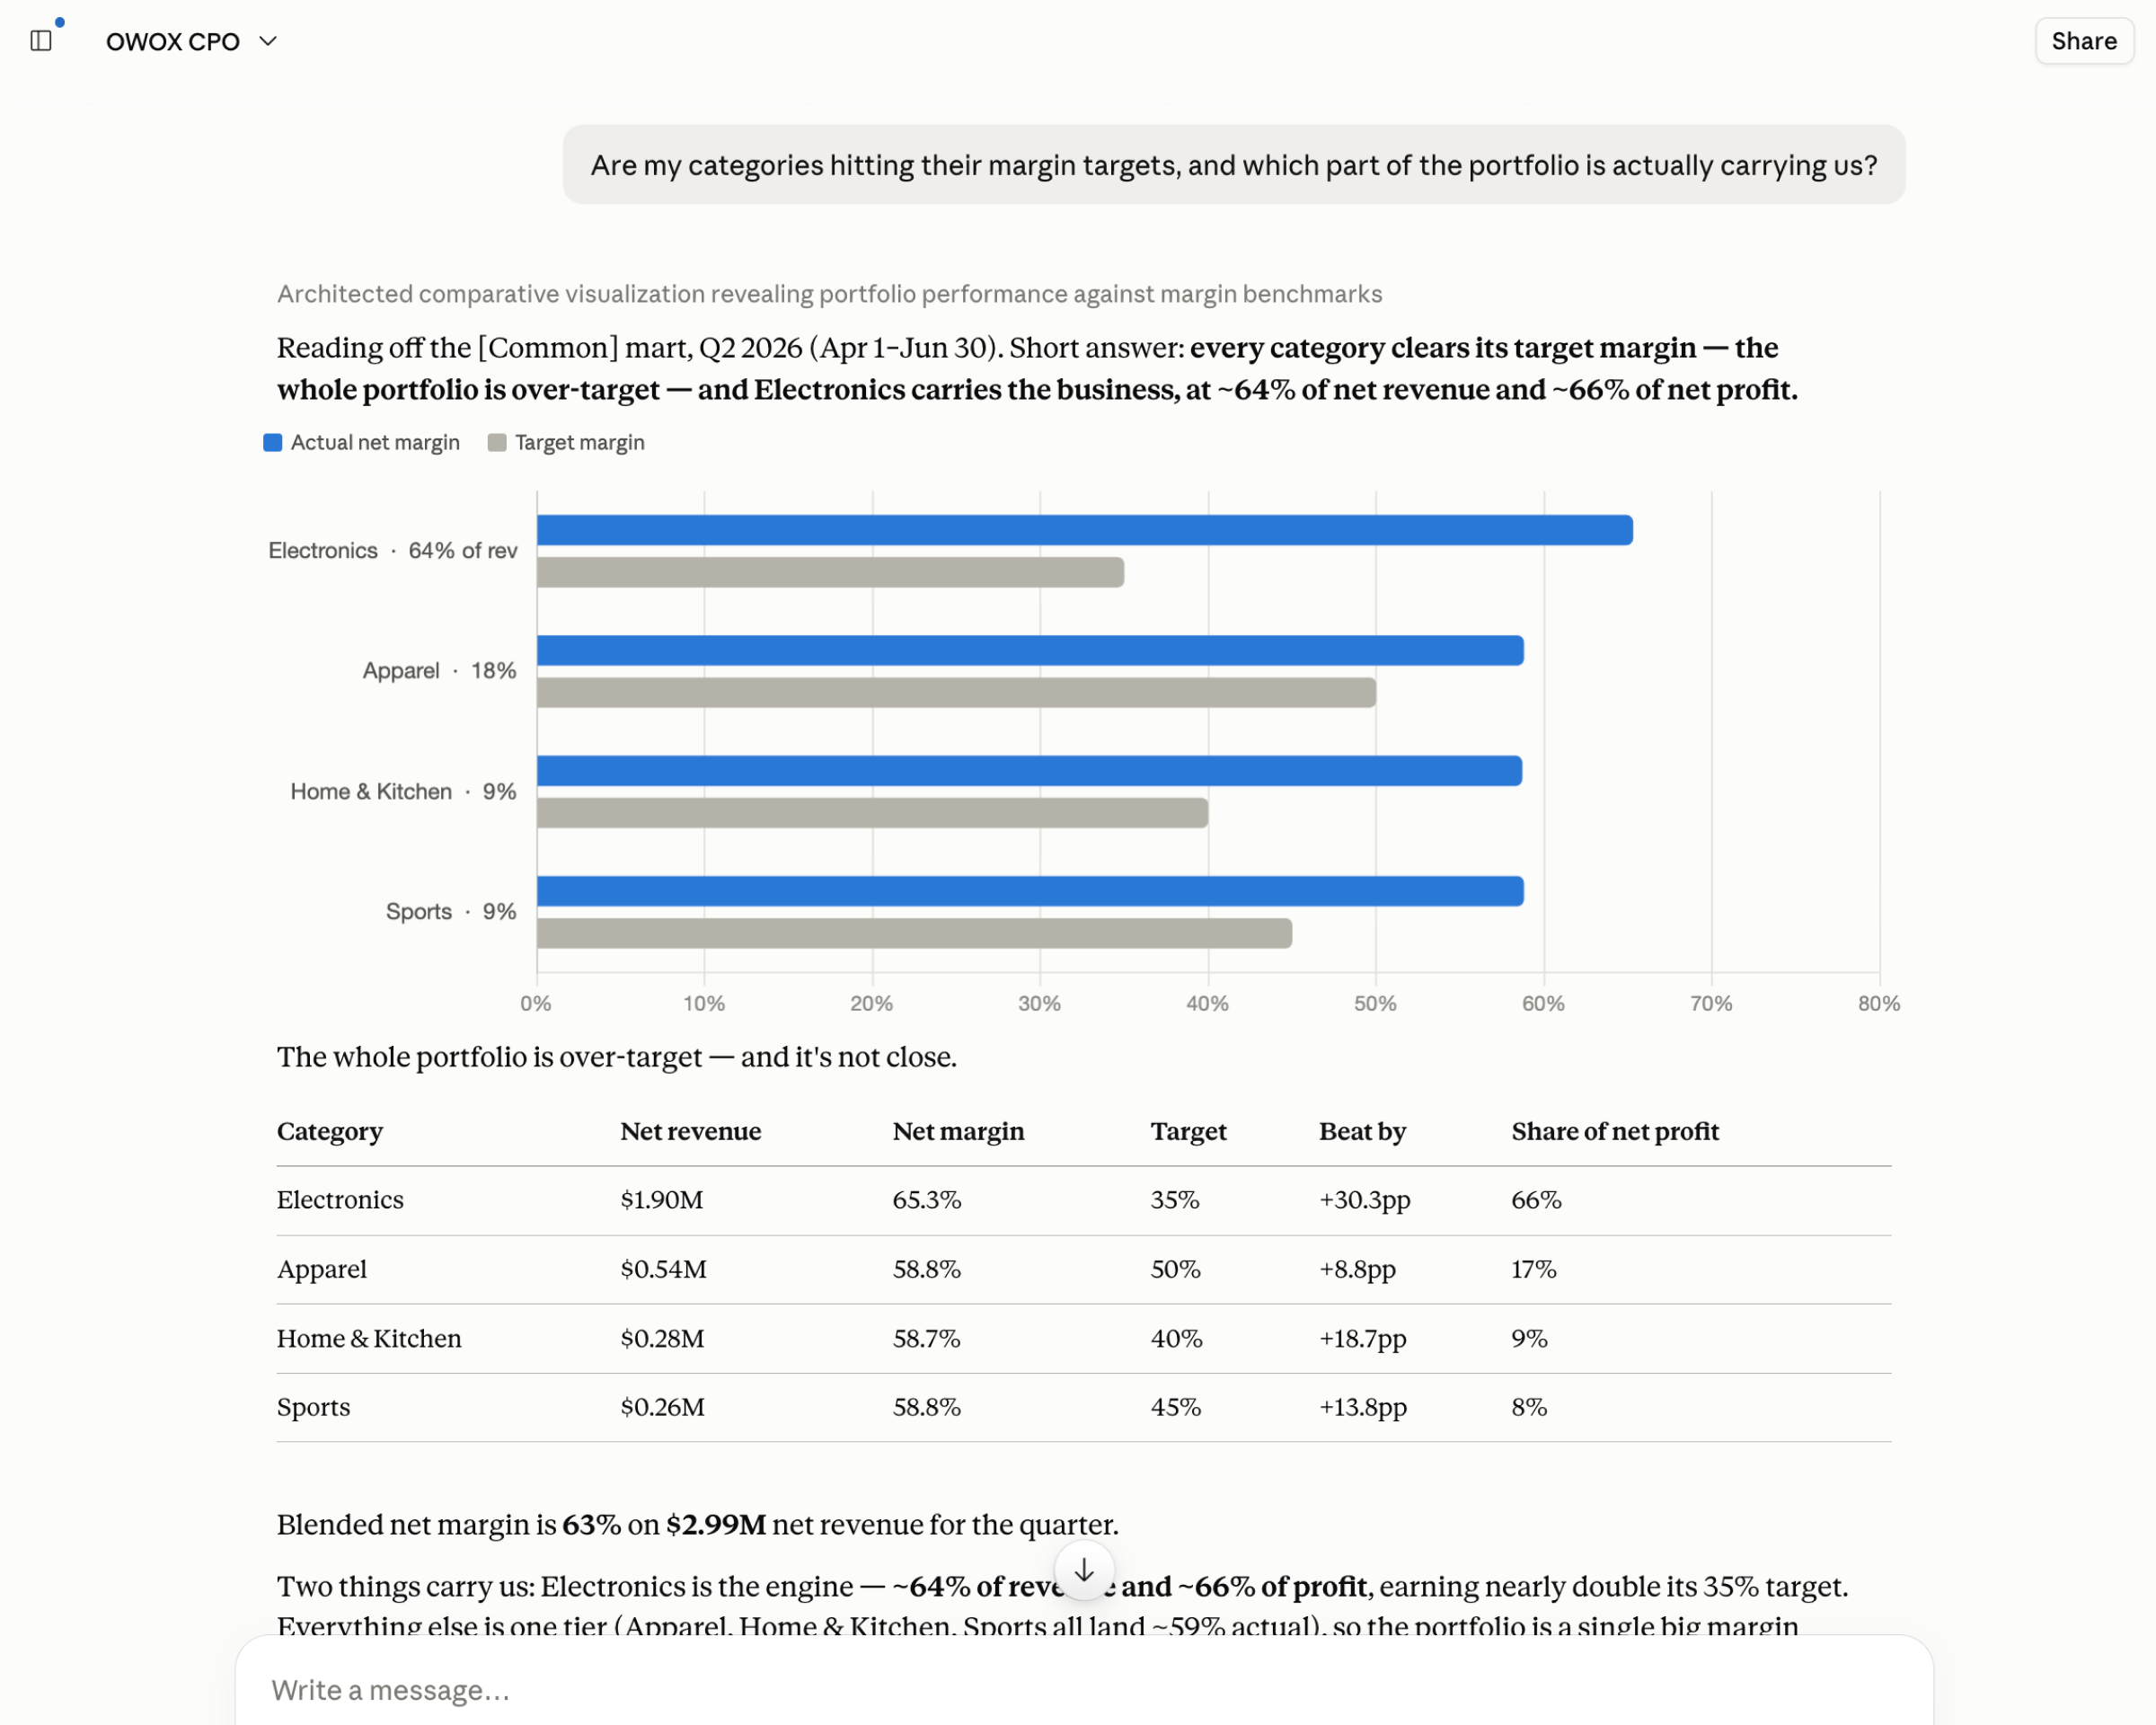
Ask in Claude or ChatGPT: "reorder rate by category, last 90 days, cohort by acquisition source?" — the join that used to take your analyst a week comes back in two prompts. Every number computed by analyst-approved SQL over governed joins. This is MCP.
- Cross-system answers on demand — orders + product + marketing + inventory, already joined — no week-long one-off query.
- Zero hallucinations: the model narrates, analyst-approved SQL computes over pre-approved join keys. It can't invent a join. Patented.
- Persist any answer to a Google Sheet for the category review.
How it works
From "let me pull that" to self-service product analytics — in three steps
Your data team joins the data. Your product team self-serves. AI delivers product intelligence. Category reviews start with answers.
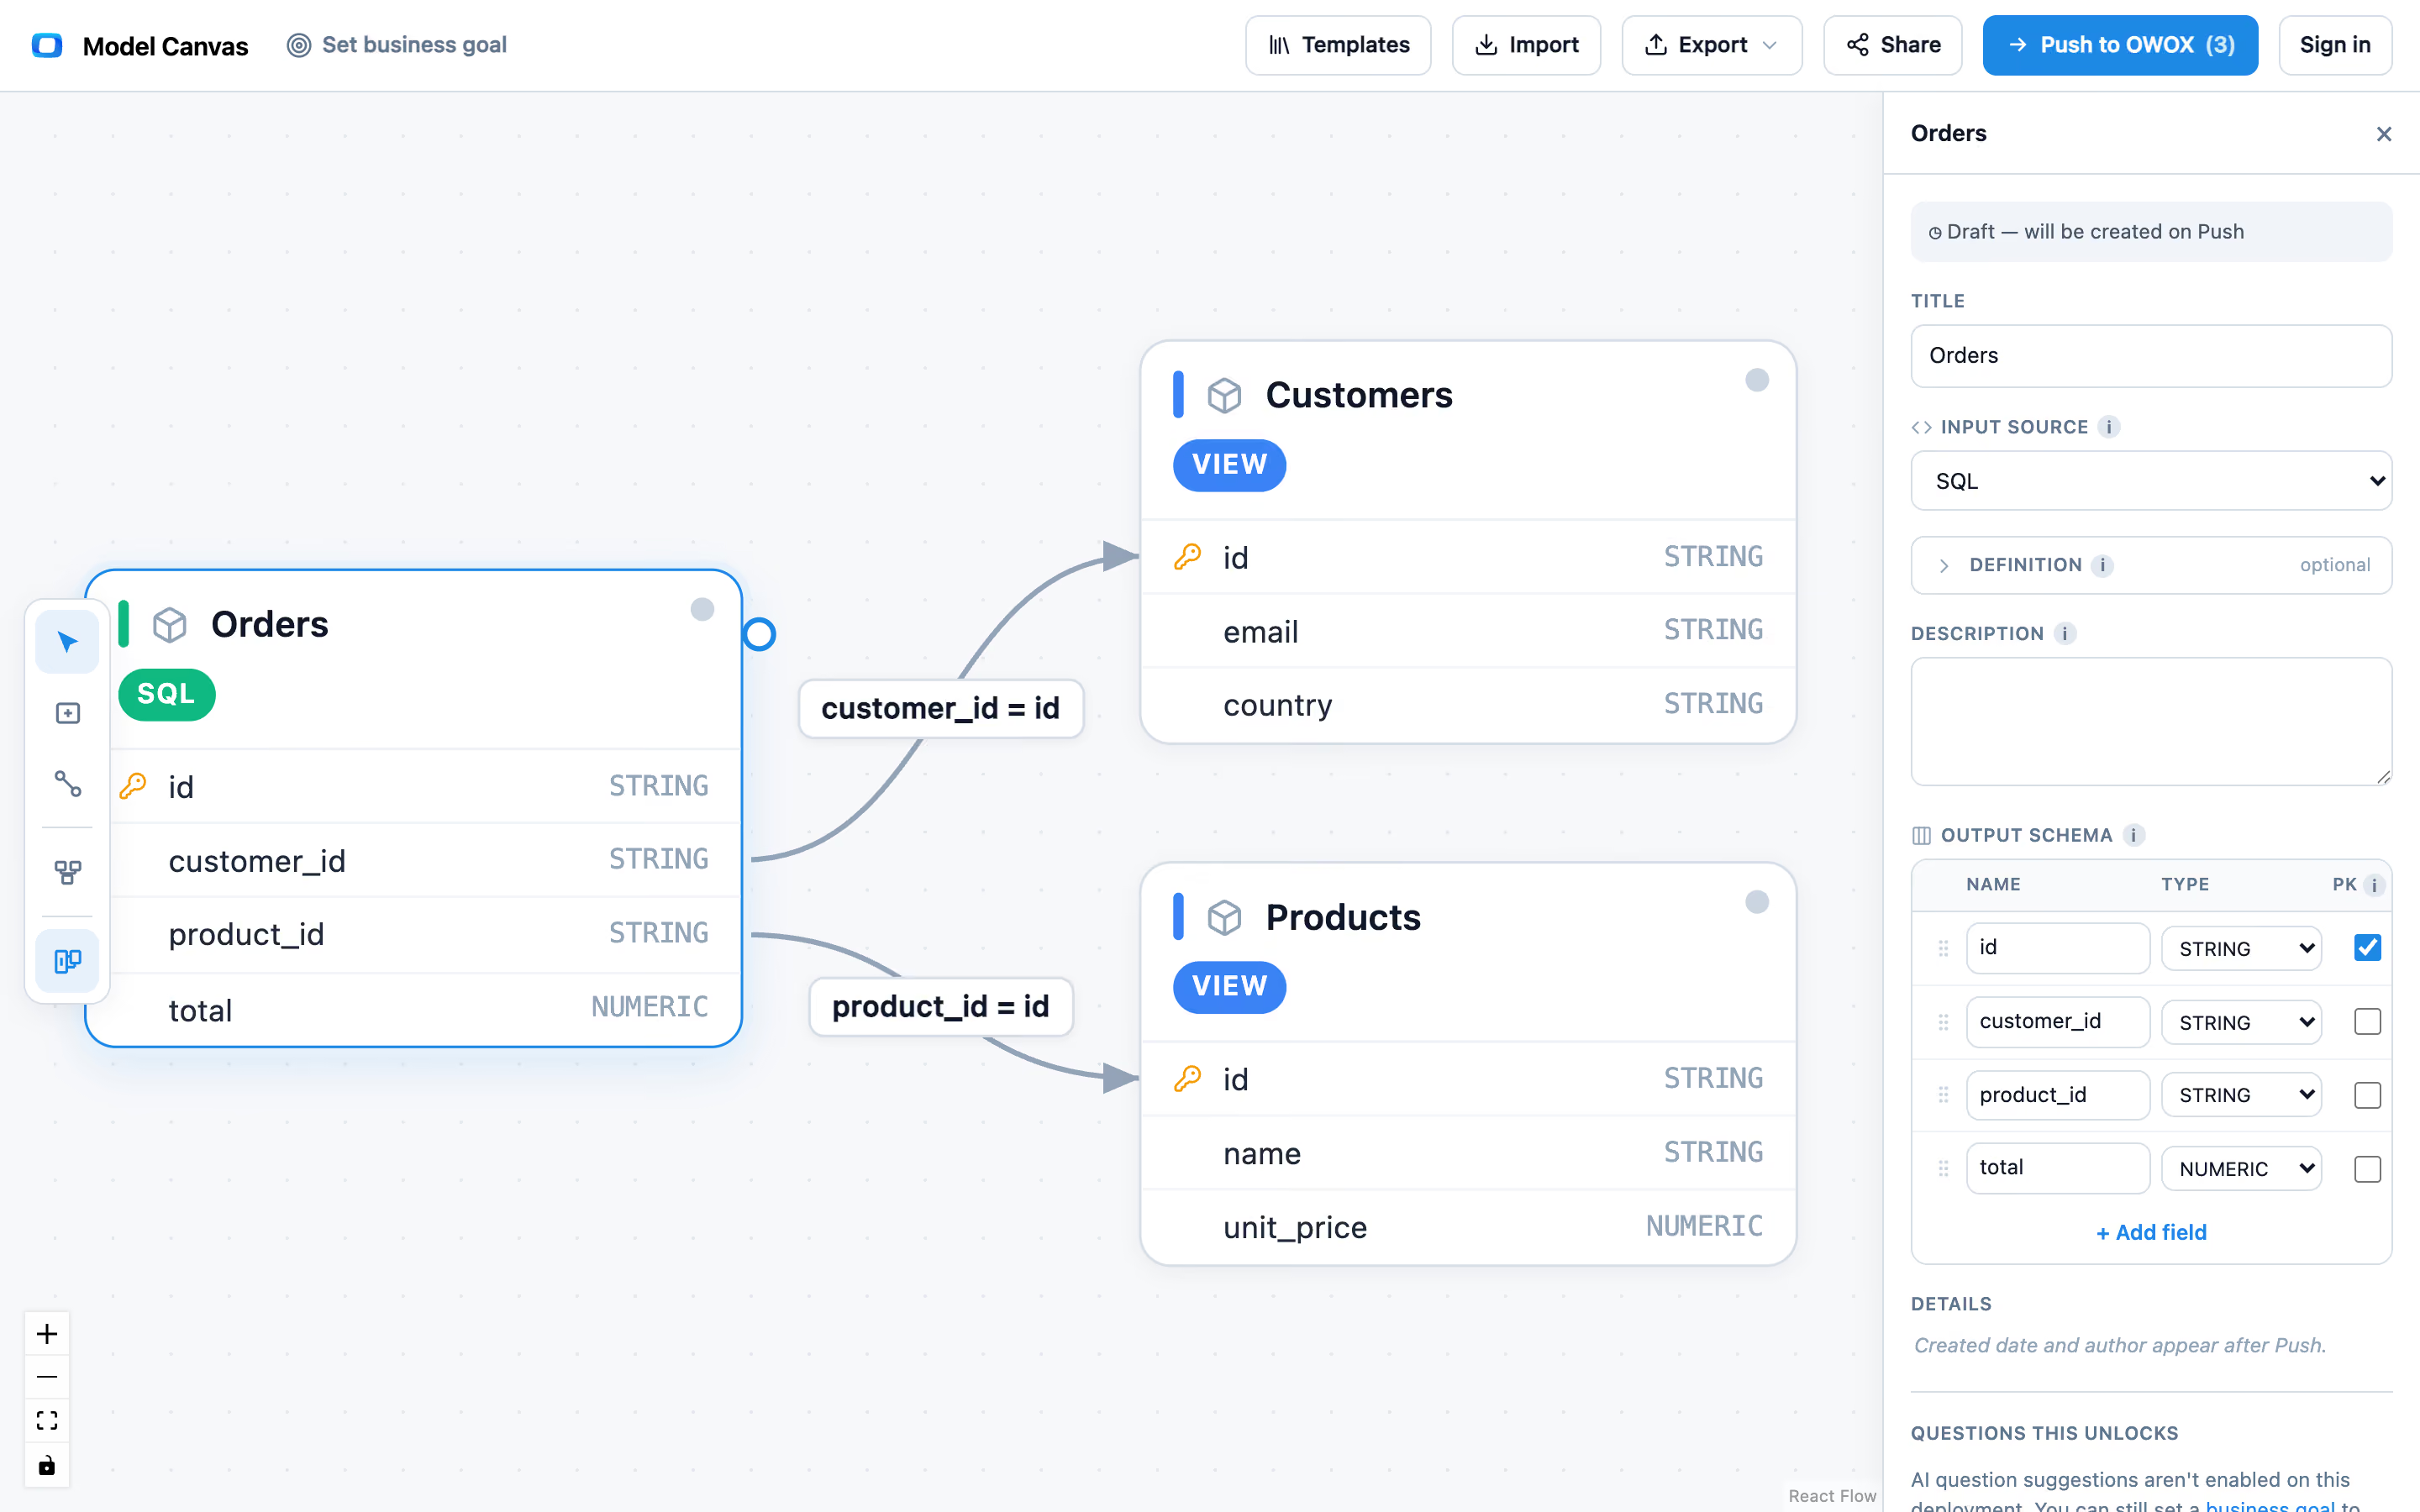
Step 1
Data team joins the systems
Orders, customers, marketing, and inventory joined and published as governed Data Marts. One definition per metric.
Step 2
Product team self-serves
Category managers open Sheets, browse the library, pick columns, filter by product line, refresh daily.
Step 3
AI delivers trusted data
Product narrative — top categories, cohort trends, inventory alerts — in claude or chatGPT. Deterministic.
What changes for your product org
Make product decisions on joined data, not siloed reports
When every system’s data lives in one governed library, the product function transforms.

Answer cross-system questions in seconds
"Which categories drive repeat purchases from paid acquisition?" — a question that used to take a week now takes 30 seconds. The join is pre-built.

Product and marketing see the same customer
Marketing attribution joined with product performance. When product says "underperforming," marketing sees which campaigns targeted it.

Your analyst builds models, not exports
When the product team self-serves cross-system data, your analyst works on demand forecasting, assortment optimization, and segmentation.
What users are saying
What product leaders say
Real things real customers said — each quote pinned to a specific claim, straight from the quotes database.
 Nodari RizunFounder & CEO, Pürblack®
“We regained time. And time is the one resource that never comes back.”
 Mark SimmonsCMO, Pürblack®
“As a marketing leader, it's so refreshing to make decisions based on data and insights rather than guesses.”
Nodari RizunFounder & CEO, Pürblack®“We don't need to wait for a report anymore. We don't wait on an engineer or an account manager — within minutes we get data, make a decision, question it, and pivot.”
Customer stories
E-commerce teams with cross-system product analytics
Product teams that joined every system’s data in one library
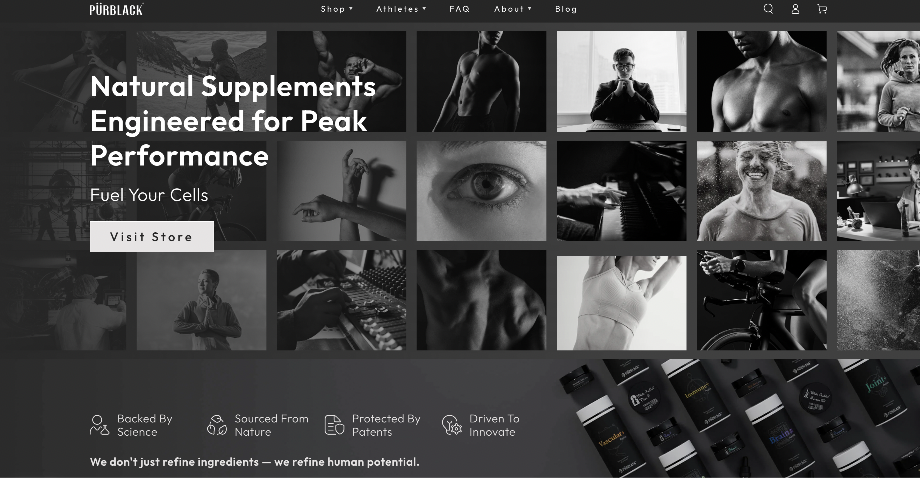 "For 10 years I was blind." The day Pürblack® founder stopped guessingSecondsto get reports across six channelsRead the story
  How OWOX Reports Helped Reformation Make Data-Backed DecisionsMinutesfrom data request to business decisionRead the story
  How OWOX Reports Streamlined Operations for WorkSimpli, Saving Over 10 Hours Weekly10hrs+saved per week on manual reportingRead the story
 WHAT YOUR DATA TEAM DEPLOYS
Every system, joined once — by the analyst your data team hires
Your data team sets up a Reporting Analyst once: it joins product, customer, marketing, and inventory data into a governed library your product team self-serves. When someone needs to ask "why did the Q1 cohort's reorder rate drop?" in plain language, the Senior Analyst answers — traceable to SQL, never hallucinated.

Reporting Data Analyst
Answers product, sales & marketing questions with presision and data in spreadsheets

Senior Data Analyst
Answers your “why” questions in plain language — @owox in Slack, Claude, ChatGPT via MCP. Traceable to SQL.
FAQ
Questions product leaders ask
Can OWOX join data from Shopify, GA4, ad platforms, and our ERP?
OWOX connects to the data warehouse where all this data lands. Most e-commerce teams already replicate Shopify orders, GA4 sessions, ad platform spend, and ERP inventory to a warehouse via Fivetran, Stitch, or native exports. OWOX sits on top: your analyst wraps each source as a Data Mart, defines join keys (order_id, customer_id, product_sku, campaign_id), and publishes the library. When your category manager joins "Category Performance" with "Inventory Levels" in Sheets, they’re running a pre-defined join across four systems — without writing SQL.
How does this help with customer cohort analysis?
Cohort analysis requires joining acquisition data (which campaign, which channel, when) with purchase behavior over time (first order, repeat orders, LTV). That data typically lives in 3+ systems. Your analyst creates a "Customer Cohorts" Data Mart joining acquisition source with order history, defines the cohort logic in SQL, and publishes it. Your product manager opens Sheets, picks the cohort Data Mart, filters by acquisition quarter or channel, and sees repeat purchase rates, revenue per cohort, and retention — refreshed daily.
My product team isn’t technical. Can they use this?
The Google Sheets Extension is a column picker. Your team browses Data Marts with names like "Category Performance" and "Customer Cohorts," checks the columns they want, applies filters, and hits refresh. No SQL, no query language, no new tool. The technical work happens once on your analyst’s side: define the Data Marts, set join keys, publish. The consumption side is point-and-click.
How does this compare to Amplitude or Mixpanel?
Amplitude and Mixpanel are excellent for product event tracking — clicks, page views, feature usage. But they only see behavior data. They can’t join it with order revenue from Shopify, marketing attribution from Facebook Ads, inventory from your ERP, or support data from Zendesk. OWOX sits on top of the warehouse where all your data converges. Your analyst wraps Amplitude exports, Shopify orders, ad platform data, and ERP inventory as Data Marts, joins them with defined keys, and publishes. Your product team gets something Amplitude can’t: "Which categories have the highest repeat purchase rate from TikTok-acquired customers, and what’s the current inventory?" — all in one Sheets report.
What does this cost?
Reporting data analyst is $65/month — includes Data Mart management and the Google Sheets Extension and AI Insights.
Senior Data Analyst starts at $95 with MCP, multi-destination delivery.
Enterprise is custom with SSO, RBAC, and monitoring. For context: building cross-system joins typically requires 2–3 weeks of analyst time per quarter — ad hoc, unreusable. OWOX turns those into governed, reusable Data Marts. Build once, self-serve for months.
How fast can my team start using this?
First product Data Marts live in a few days — connect the warehouse, wrap your product, order, and customer tables, define join keys, publish. Your product team sees the library in Sheets immediately. A full cross-system library — categories × customers × marketing × inventory — typically takes about a week of analyst time. AI Insights deliver your first weekly brief the following Monday. No six-month project. Build incrementally: start with the questions that come up in every category review.