Dashboards
Facebook Ads Dashboard Template
Compare the effectiveness of ad campaigns
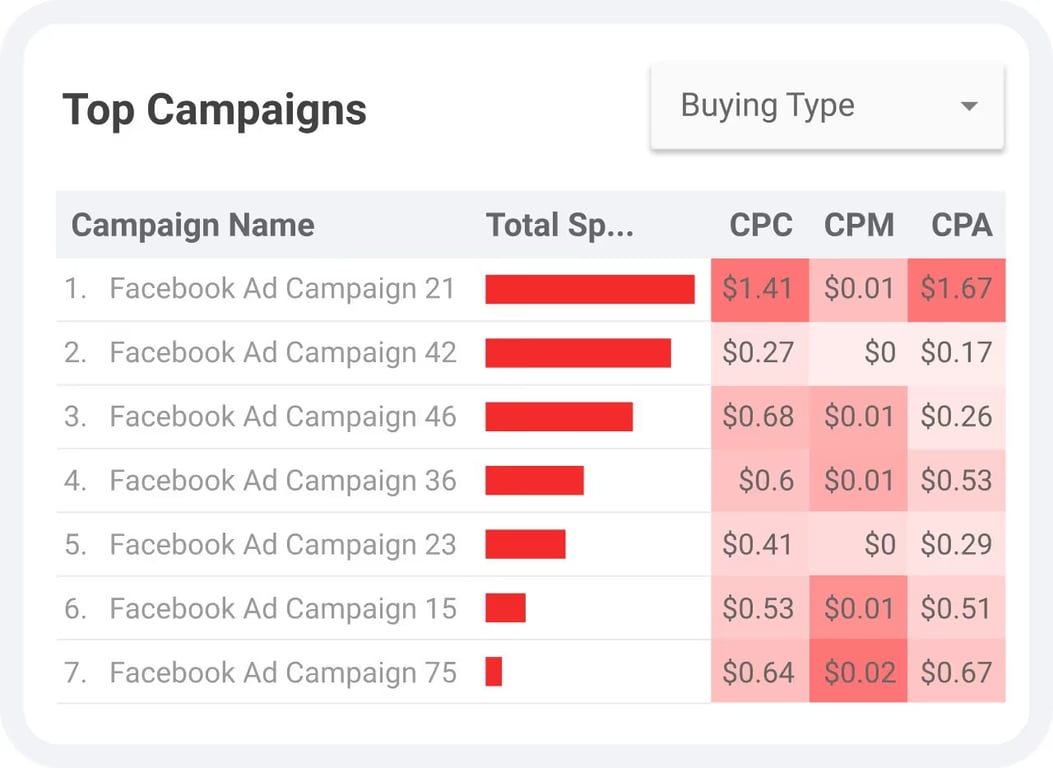
Thanks to this dashboard, you will see a complete picture of the costs of advertising campaigns and understand how to adjust your budget.
Focus your efforts on campaigns that work better than others — that is, campaigns that have a low cost per action or click but at the same time motivate users to perform targeted actions.
S01 · Dashboards
Monitor key KPI dynamics and optimize campaigns
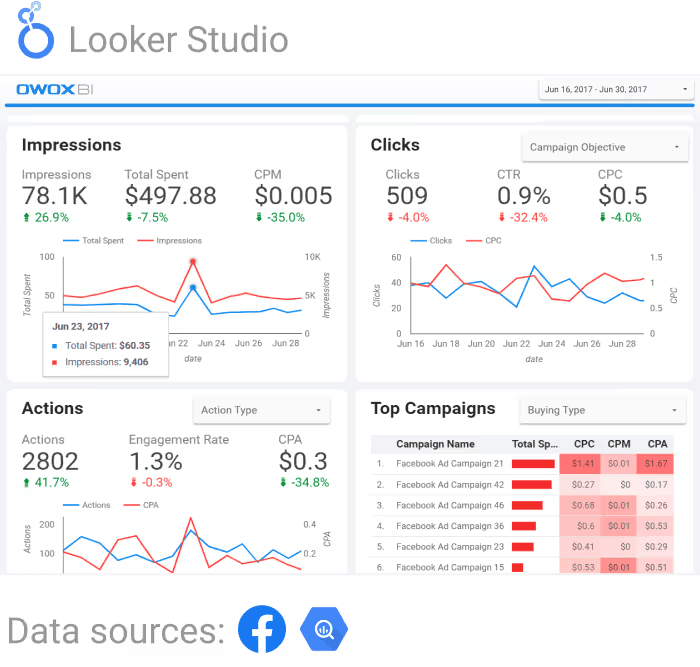
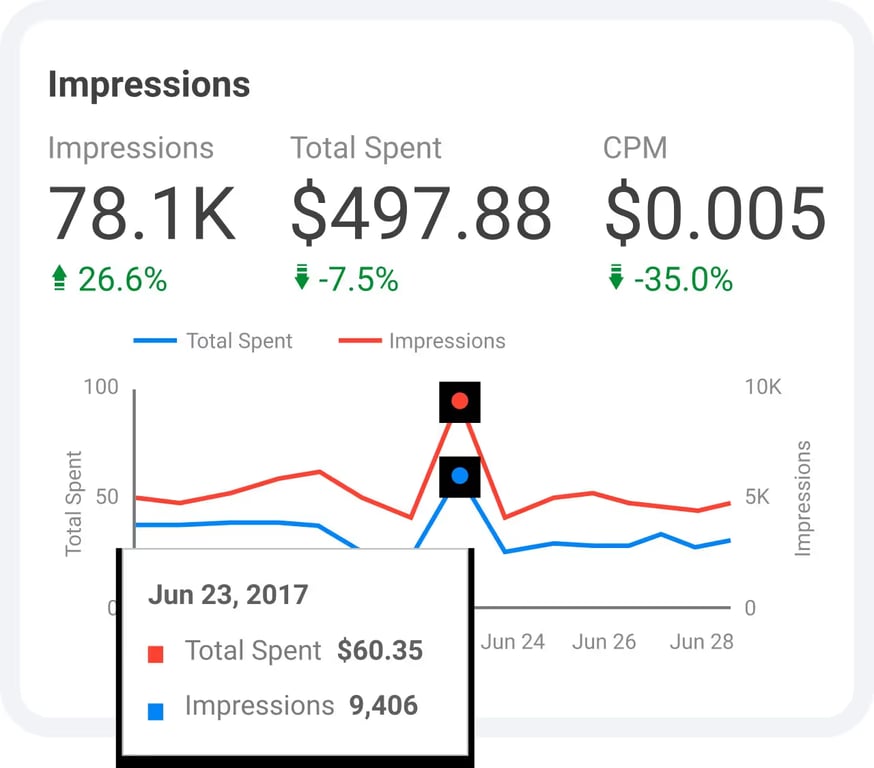
Track the impressions, clicks, CPM, CTR, and CPC of your Facebook ads. Respond to changes in metrics in time and optimize campaigns.
Analyze how advertising costs have changed compared to the number of ad shows. Find days when there were more impressions and clicks and lower costs for impressions. Perhaps it’s on these days of the week that most of your target audience is online, in which case you can schedule your ads accordingly.
S02 · Dashboards
Learn how users interact with your ads
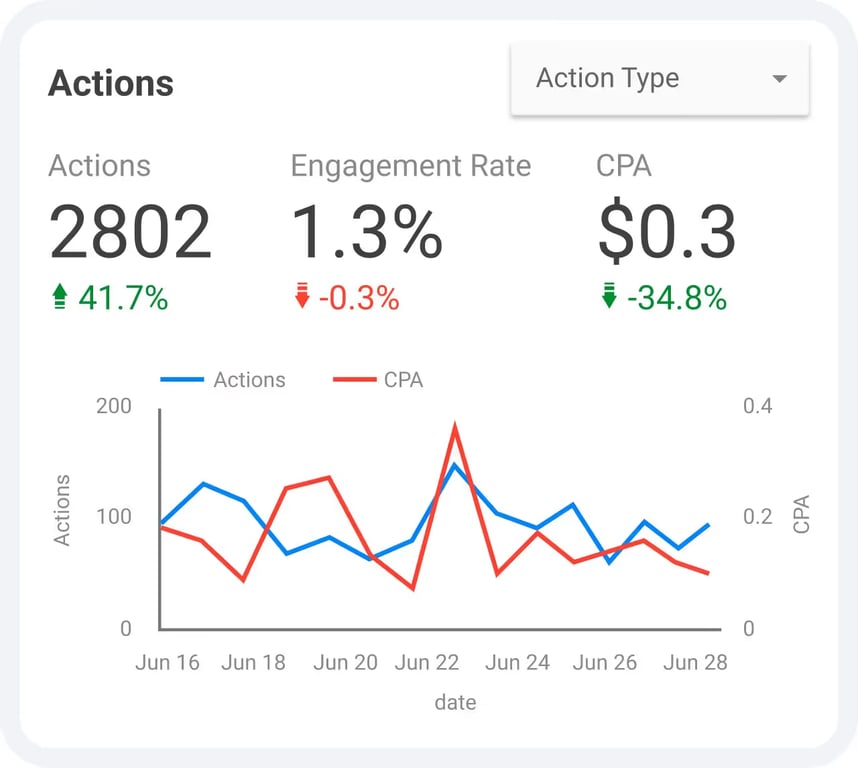
Analyze statistics on all actions: likes, reposts, clicks on links to the website, page subscriptions, comments, etc. Find out how much you pay on average for certain user interactions with ads and on which days users are the most and least active.
This dashboard will show which KPIs are getting worse so you can improve your ads in time. For example, if the Engagement Rate is down, you can change your CTA or offer rewards to users for the actions you want to encourage.
More dashboards