
Case StudiesSaaS
SEMrush increases conversion rates by optimizing the sales funnel and reallocating ad budget
Funnelconversion rates up via sales funnel fix

Objective
Objective
Most companies face the not so trivial task of assessing the effectiveness of traffic sources. For SaaS companies it is especially important because the sales funnel can be divided into two different paying customers.
It usually takes more than one session for the average user to complete the funnel and each visit is a different interaction type (pageviews and events).
That is why it is crucial to create custom sales funnels. In addition to that it is essential to analyze customer behaviour inside the sales funnel to eliminate possible bottlenecks.
To evaluate the efficiency of each traffic source, the following questions need to be answered:
- Which traffic sources bring in the most leads?
- What is the share between the traffic sources? Does the share stay the same for different steps in the sales funnel?
- Which traffic sources produce the most payable conversions?
- Do the traffic sources interfere with each other? If so, where is the overlap?
- How to attribute revenue to traffic sources in cases where more than one traffic source was involved.
To provide answers, we needed to use a tool where we could analyze raw user interaction data. Taking into account the sampling issue, we chose Google BigQuery.
Solution
Solution
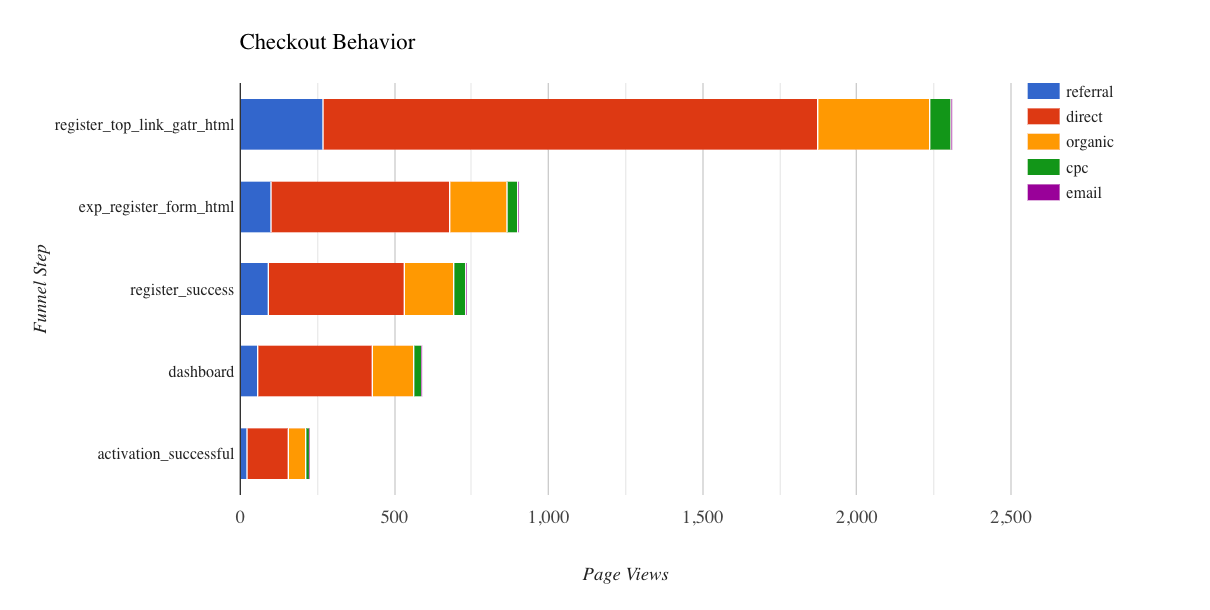
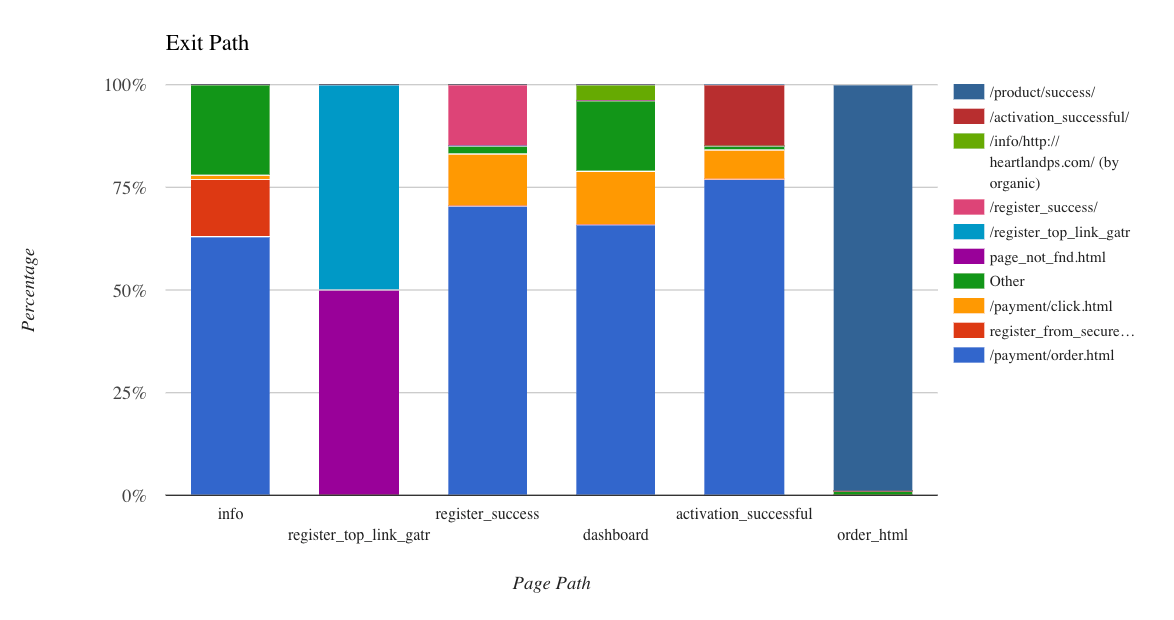
By using the sequences and discrete main steps from the buying process flowchart, we worked with SEMrush to identify the main groups of traffic sources for analysis and defined the sales funnel. After that, we defined the list of the most popular exits that visitors took when they left the funnel.
To send data to Google BigQuery, SEMrush used OWOX BI Streaming service. Since they have the timestamp of each separate interaction with the website’s content, it was possible to build any sequence of user actions and combine them into one report across several sessions.
For building graphs and making sense out of the data SEMrush used the BigQuery Reports add-on that exported data from Google BigQuery into Google Sheets.
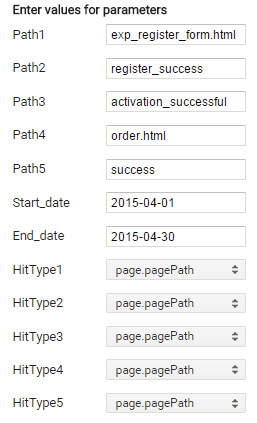
OWOX created queries that were available to everyone who had access to the SEMrush project in Google Cloud Platform using the add-on’s feature of including dynamic parameters. This way requests could be modified in the interface without touching the query.It allowed even non-technical marketing and management users to create and customize reports based on queries to Google BigQuery.The last step was to build and visualize reports in Google Sheets, using the BigQuery Reports Add-on.
Results
Results
- Ability to identify the traffic source for each step inside the sales funnel.
- Sales funnel optimization increased conversion rates.
Topics
About the author

More stories